Our mission is to help computational modelers develop, document, and share their computational models in accordance with community standards and good open science and software engineering practices. Model authors can publish their model source code in the Computational Model Library with narrative documentation as well as metadata that supports open science and emerging norms that facilitate software citation, computational reproducibility / frictionless reuse, and interoperability. Model authors can also request private peer review of their computational models. Models that pass peer review receive a DOI once published.
All users of models published in the library must cite model authors when they use and benefit from their code.
Please check out our model publishing tutorial and feel free to contact us if you have any questions or concerns about publishing your model(s) in the Computational Model Library.
Displaying 10 of 1186 results for "J A Cuesta" clear search
The tragedy of the park: an agent-based model on endogenous and exogenous institutions for the management of a forest.
Elena Vallino | Published Wednesday, March 27, 2013 | Last modified Thursday, April 26, 2018I model a forest and a community of loggers. Agents follow different kinds of rules in order to log. I compare the impact of endogenous and of exogenous institutions on the state of the forest and on the profit of the users, representing different scenarios of participatory conservation projects.
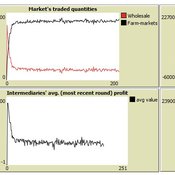
Market-level effects of firm-level adaptation and intermediation in networked markets of fresh foods: a case study in Colombia.
César García-Díaz | Published Sunday, April 12, 2020 | Last modified Sunday, April 12, 2020This a model developed as a part of the paper Mejía, G. & García-Díaz, C. (2018). Market-level effects of firm-level adaptation and intermediation in networked markets of fresh foods: a case study in Colombia. Agricultural Systems 160: 132-142.
It simulates the competition dynamics of the potato market in Bogotá, Colombia. The model explores the economic impact of intermediary actors on the potato supply chain.
The Effect of Individual and Collective Characteristics on Team Performance: A Model of Networked Agents Engaged in Collective Problem Solving
Amin Boroomand | Published Tuesday, March 16, 2021 | Last modified Monday, July 26, 2021This code is for an agent-based model of collective problem solving in which agents with different behavior strategies, explore the NK landscape while they communicate with their peers agents. This model is based on the famous work of Lazer, D., & Friedman, A. (2007), The network structure of exploration and exploitation.
An Agent-Based Model of an Insurer's Estimated Capital Requirement in a Simple Insurance Market with Imperfect Information in C#
Rei England | Published Sunday, September 24, 2023This is an agent-based model of a simple insurance market with two types of agents: customers and insurers. Insurers set premium quotes for each customer according to an estimation of their underlying risk based on past claims data. Customers either renew existing contracts or else select the cheapest quote from a subset of insurers. Insurers then estimate their resulting capital requirement based on a 99.5% VaR of their aggregate loss distributions. These estimates demonstrate an under-estimation bias due to the winner’s curse effect.
Multi-agent modeling and analysis of the knowledge learning of a human-machine hybrid intelligent organization with human-machine trust
Haoxiang Zhang | Published Monday, April 24, 2023Machine learning technologies have changed the paradigm of knowledge discovery in organizations and transformed traditional organizational learning to human-machine hybrid intelligent organizational learning. However, it remains unclear how human-machine trust, which is an important factor that influences human-machine knowledge exchange, affects the effectiveness of human-machine hybrid intelligent organizational learning. To explore this issue, we used multi-agent simulation to construct a knowledge learning model of a human-machine hybrid intelligent organization with human-machine trust.
Collective Decision Making for Ecological Restoration version 2.0
Dean Massey Moira Zellner Cristy Watkins Jeremy Brooks Kristen Ross Lynne M Westphal | Published Wednesday, November 19, 2014CoDMER v. 2.0 was parameterized with ethnographic data from organizations dealing with prescribed fire and seeding native plants, to advance theory on how collective decisions emerge in ecological restoration.
User Guide and Templates for RAT-RS (a reporting standard for improving the documentation of data use in agent-based modelling)
Melania Borit Edmund Chattoe-Brown Peer-Olaf Siebers Sebastian Achter | Published Saturday, March 12, 2022The Rigor and Transparency Reporting Standard (RAT-RS) is a tool to improve the documentation of data use in Agent-Based Modelling. Following the development of reporting standards for models themselves, attention to empirical models has now reached a stage where these standards need to take equally effective account of data use (which until now has tended to be an afterthought to model description). It is particularly important that a standard should allow the reporting of the different uses to which data may be put (specification, calibration and validation), but also that it should be compatible with the integration of different kinds of data (for example statistical, qualitative, ethnographic and experimental) sometimes known as mixed methods research.
For the full details on the RAT-RS, please refer to the related publication “RAT-RS: A Reporting Standard for Improving the Documentation of Data Use in Agent-Based Modelling” (http://dx.doi.org/10.1080/13645579.2022.2049511).
Here we provide supplementary material for this article, consisting of a RAT-RS user guide and RAT-RS templates.
Multi-level model of attitudinal dynamics
Ingo Wolf | Published Wednesday, April 06, 2016 | Last modified Wednesday, May 04, 2016A model of attitudinal dynamics based on the cognitive mechanism of emotional coherence. The code is written in Java. For initialization an additional dataset is required.
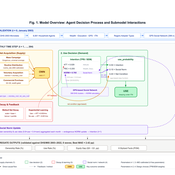
Peer reviewed Kenya ITN Agent-Based Microsimulation (2003–2024)
Wooyoung Kim Hosang Shin | Published Saturday, April 18, 2026 | Last modified Tuesday, June 16, 2026An agent-based microsimulation of insecticide-treated net (ITN) distribution and adoption in Kenya (2003–2024), integrating the Theory of Planned Behaviour, Rogers diffusion, Weibull net decay, and a GPS-based two-layer social network. 8,561 household agents calibrated via Approximate Bayesian Computation to six DHS/MIS survey waves, achieving 2.42 pp mean absolute error on Kenya-level ownership. The analysis chain supports mechanism counterfactuals and policy experiments on equity outcomes of ITN distribution strategies.
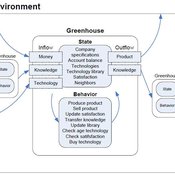
Universal Darwinism in Dutch Greenhouses
Julia Kasmire | Published Wednesday, May 09, 2012 | Last modified Saturday, April 27, 2013An ABM, derived from a case study and a series of surveys with greenhouse growers in the Westland, Netherlands. Experiments using this model showshow that the greenhouse horticulture industry displays diversity, adaptive complexity and an uneven distribution, which all suggest that the industry is an evolving system.
Displaying 10 of 1186 results for "J A Cuesta" clear search