Our mission is to help computational modelers develop, document, and share their computational models in accordance with community standards and good open science and software engineering practices. Model authors can publish their model source code in the Computational Model Library with narrative documentation as well as metadata that supports open science and emerging norms that facilitate software citation, computational reproducibility / frictionless reuse, and interoperability. Model authors can also request private peer review of their computational models. Models that pass peer review receive a DOI once published.
All users of models published in the library must cite model authors when they use and benefit from their code.
Please check out our model publishing tutorial and feel free to contact us if you have any questions or concerns about publishing your model(s) in the Computational Model Library.
Displaying 10 of 1348 results Sort by: Recently modified clear search
Socio-hydrologicalModel_version_SESMO
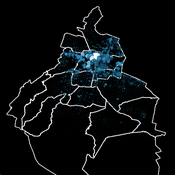
Andres Baeza-Castro Luis Bojorquez Marco Janssen Hallie Eakin Fidel Serrano-Candela Paola Gomez Yosune Miquelajauregui Rodrigo Garcia-Herrera | Published Tuesday, February 05, 2019We present here MEGADAPT_SESMO model. A hybrid, dynamic, spatially explicit, integrated model to simulate the vulnerability of urban coupled socio-ecological systems – in our case, the vulnerability of Mexico City to socio-hydrological risk.
Modeling the decline of labor-sharing in highly variable environments
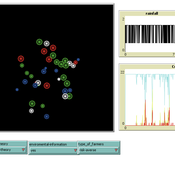
Andres Baeza-Castro Marco Janssen | Published Tuesday, April 02, 2019The rapid environmental changes currently underway in many dry regions of the world, and the deep uncertainty about their consequences, underscore a critical challenge for sustainability: how to maintain cooperation that ensures the provision of natural resources when the benefits of cooperating are variable, sometimes uncertain, and often limited. We present an agent-based model that simulates the economic decisions of households to engage, or not, in labor-sharing agreements under different scenarios of water supply, water variability, and socio-environmental risk. We formulate the model to investigate the consequences of environmental variability on the fate of labor-sharing agreements between farmers. The economic decisions were implemented in the framework of prospect theory.
MEGADAPT - Socio-hydrological risk model - Theoretical (no data) implementation
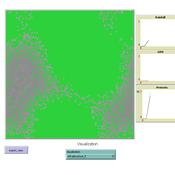
Andres Baeza-Castro Luis Bojorquez Marco Janssen Hallie Eakin | Published Wednesday, February 06, 2019The model simulates the decisions of residents and a water authority to respond to socio-hydrological hazards. Residents from neighborhoods are located in a landscape with topographic complexity and two problems: water scarcity in the peripheral neighborhoods at high altitude and high risk of flooding in the lowlands, at the core of the city. The role of the water authority is to decide where investments in infrastructure should be allocated to reduce the risk to water scarcity and flooding events in the city, and these decisions are made via a multi-objective site selection procedure. This procedure accounts for the interdependencies and feedback between the urban landscape and a policy scenario that defines the importance, or priorities, that the authority places on four criteria.
Neighborhoods respond to the water authority decisions by protesting against the lack of investment and the level of exposure to water scarcity and flooding. Protests thus simulate a form of feedback between local-level outcomes (flooding and water scarcity) and higher-level decision-making. Neighborhoods at high altitude are more likely to be exposed to water scarcity and lack infrastructure, whereas neighborhoods in the lowlands tend to suffer from recurrent flooding. The frequency of flooding is also a function of spatially uniform rainfall events. Likewise, neighborhoods at the periphery of the urban landscape lack infrastructure and suffer from chronic risk of water scarcity.
The model simulates the coupling between the decision-making processes of institutional actors, socio-political processes and infrastructure-related hazards. In the documentation, we describe details of the implementation in NetLogo, the description of the procedures, scheduling, and the initial conditions of the landscape and the neighborhoods.
This work was supported by the National Science Foundation under Grant No. 1414052, CNH: The Dynamics of Multi-Scalar Adaptation in Megacities (PI Hallie Eakin).
AnimDens NetLogo
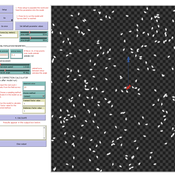
Miguel Pais Christine Ward-Paige | Published Friday, February 10, 2017 | Last modified Sunday, February 23, 2020The model demonstrates how non-instantaneous sampling techniques produce bias by overestimating the number of counted animals, when they move relative to the person counting them.
PluchinoEtAl_ExtendedByAC
Andre Costopoulos | Published Tuesday, September 03, 2019 | Last modified Friday, January 31, 2020Extension of Pluchino et al.’s 2018 success vs talent model, to allow talented individuals to mitigate unlucky events.
The Informational Dynamics of Regime Change
Dominik Klein Johannes Marx | Published Saturday, October 07, 2017 | Last modified Tuesday, January 14, 2020We model the epistemic dynamics preceding political uprising. Before deciding whether to start protests, agents need to estimate the amount of discontent with the regime. This model simulates the dynamics of group knowledge about general discontent.
Telephone Game
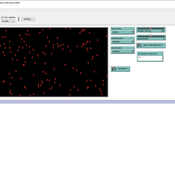
Julia Kasmire | Published Friday, January 10, 2020This is a model of a game of Telephone (also known as Chinese Whishpers in the UK), with agents representing people that can be asked, to play. The first player selects a word from their internal vocabulary and “whispers” it to the next player, who may mishear it depending on the current noise level, who whispers that word to the next player, and so on.
When the game ends, the word chosen by the first player is compared to the word heard by the last player. If they match exactly, all players earn large prize. If the words do not match exactly, a small prize is awarded to all players for each part of the words that do match. Players change color to reflect their current prize-count. A histogram shows the distribution of colors over all the players.
The user can decide on factors like
* how many players there are,
…
City Sandbox
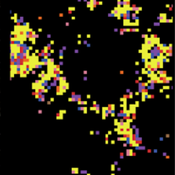
Javier Sandoval | Published Thursday, January 09, 2020This model grows land use patterns that emerge as a result of land-use compatibilities stablished in urban development plans, land topography, and street networks. It contains urban brushes to paint streets and land uses as a way to learn about urban pattern emergence through free experimentation.
Spatio-Temporal Dynamic of Risk Model
J Jumadi | Published Tuesday, October 22, 2019 | Last modified Sunday, January 05, 2020This model aims to simlulate the dynamic of risk over time and space.
A Bottom-Up Simulation on Competition and Displacement of Online Interpersonal Communication Platforms
great-sage-futao | Published Tuesday, December 31, 2019 | Last modified Tuesday, December 31, 2019This model aims to simulate Competition and Displacement of Online Interpersonal Communication Platforms process from a bottom-up angle. Individual interpersonal communication platform adoption and abandonment serve as the micro-foundation of the simulation model. The evolution mode of platform user online communication network determines how present platform users adjust their communication relationships as well as how new users join that network. This evolution mode together with innovations proposed by individual interpersonal communication platforms would also have impacts on the platform competition and displacement process and result by influencing individual platform adoption and abandonment behaviors. Three scenes were designed to simulate some common competition situations occurred in the past and current time, that two homogeneous interpersonal communication platforms competed with each other when this kind of platforms first came into the public eye, that a late entrant platform with a major innovation competed with the leading incumbent platform during the following days, as well as that both the leading incumbent and the late entrant continued to propose many small innovations to compete in recent days, respectively.
Initial parameters are as follows: n(Nmax in the paper), denotes the final node number of the online communication network node. mi (m in the paper), denotes the initial degree of those initial network nodes and new added nodes. pc(Pc in the paper), denotes the proportion of links to be removed and added in each epoch. pst(Pv in the paper), denotes the proportion of nodes with a viscosity to some platforms. comeintime(Ti in the paper), denotes the epoch when Platform 2 joins the market. pit(Pi in the paper), denotes the proportion of nodes adopting Platform 2 immediately at epoch comeintime(Ti). ct(Ct in the paper), denotes the Innovation Effective Period length. In Scene 2, There is only one major platform proposed by Platform 2, and ct describes that length. However, in Scene 3, Platform 2 and 1 will propose innovations alternately. And so, we set ct=10000 in simulation program, and every jtt epochs, we alter the innovation proposer from one platform to the other. Hence in this scene, jtt actually denotes the Innovation Effective Period length instead of ct.
Displaying 10 of 1348 results Sort by: Recently modified clear search