About the CoMSES Model Library more info
Our mission is to help computational modelers at all levels engage in the establishment and adoption of community standards and good practices for developing and sharing computational models. Model authors can freely publish their model source code in the Computational Model Library alongside narrative documentation, open science metadata, and other emerging open science norms that facilitate software citation, reproducibility, interoperability, and reuse. Model authors can also request peer review of their computational models to receive a DOI.
All users of models published in the library must cite model authors when they use and benefit from their code.
Please check out our model publishing tutorial and contact us if you have any questions or concerns about publishing your model(s) in the Computational Model Library.
We also maintain a curated database of over 7500 publications of agent-based and individual based models with additional detailed metadata on availability of code and bibliometric information on the landscape of ABM/IBM publications that we welcome you to explore.
Displaying 10 of 226 results other clear search
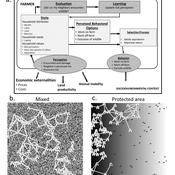
Wildlife-Human Interactions in Shared Landscapes (WHISL)
Nicholas Magliocca Neil Carter Andres Baeza-Castro | Published Friday, May 22, 2020This model simulates a group of farmers that have encounters with individuals of a wildlife population. Each farmer owns a set of cells that represent their farm. Each farmer must decide what cells inside their farm will be used to produce an agricultural good that is self in an external market at a given price. The farmer must decide to protect the farm from potential encounters with individuals of the wildlife population. This decision in the model is called “fencing”. Each time that a cell is fenced, the chances of a wildlife individual to move to that cell is reduced. Each encounter reduces the productive outcome obtained of the affected cell. Farmers, therefore, can reduce the risk of encounters by exclusion. The decision of excluding wildlife is made considering the perception of risk of encounters. In the model, the perception of risk is subjective, as it depends on past encounters and on the perception of risk from other farmers in the community. The community of farmers passes information about this risk perception through a social network. The user (observer) of the model can control the importance of the social network on the individual perception of risk.
The Coevolution of the Firm and the Product Attribute Space
César García-Díaz | Published Friday, May 22, 2020This model inspects the performance of firms as the product attribute space changes, which evolves as a consequence of firms’ actions. Firms may create new product variants by dragging demand from other existing variants. Firms decide whether to open new product variants, to invade existing ones, or to keep their variant portfolio. At each variant there is a Cournot competition each round. Competition is nested since many firms compete at many variants simultaneously, affecting firm composition at each location (variant).
After the Cournot outcomes, at each round firms decide whether to (i) keep their existing product variant niche, (ii) invade an existing variant, (iii) create a new variant, or (iv) abandon a variant. Firms’ profits across their niche take into consideration the niche-width cost and the cost of opening a new variant.
Introduction of a contact tracking app for outbreak control
Tim Verwaart | Published Tuesday, April 21, 2020The application of a smartphone application to register physical encounters between individuals is considered by public health authorities, as a means to reduce the number of infections in the 2020 COVID-19 pandemic. The general idea is that continuous registration of all other smartphones in the vicinity of an individual’s smartphone potentially enables early warning of the owners of the other smartphones, in case the individual is tested positive as infected. Those other individuals can then go into isolation and be considered for testing. The purpose of the present simulation is to explore the potential effects of this application on frequencies of infection, isolation, and positive and negative infection test results.
Gender differentiation model
Sylvie Huet | Published Monday, April 20, 2020 | Last modified Thursday, April 23, 2020This is a gender differentiation model in terms of reputations, prestige and self-esteem (presented in the paper https://journals.plos.org/plosone/article?id=10.1371/journal.pone.0236840). The model is based on the influence function of the Leviathan model (Deffuant, Carletti, Huet 2013 and Huet and Deffuant 2017) considering two groups.
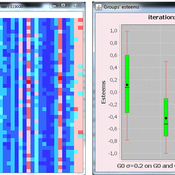
This agent-based model studies how inequalities can be explained by the difference of open-mindness between two groups of interacting agents. We consider agents having an opinion/esteem about each other and about themselves. During dyadic meetings, agents change their respective opinion about each other and possibly about other agents they gossip about, with a noisy perception of the opinions of their interlocutor. Highly valued agents are more influential in such encounters. We study an heterogeneous population of two different groups: one more open to influence of others, taking less into account their perceived difference of esteem, called L; a second one less prone to it, called S, who designed the credibility they give to others strongly based on how higher or lower valued than themselves they perceive them.
We show that a mixed population always turns in favor to some agents belonging to the group of less open-minded agents S, and harms the other group: (1) the average group self-opinion or reputation of S is always better than the one of L; (2) the higher rank in terms of reputation are more frequently occupied by the S agents while the L agents occupy more the bottom rank; (3) the properties of the dynamics of differentiation between the two groups are similar to the properties of the glass ceiling effect proposed by Cotter et al (2001).
Peer reviewed MIOvPOPsurveillance
Aniruddha Belsare | Published Monday, April 13, 2020MIOvPOPsurveillance is set up to simulate harvest-based chronic wasting disease (CWD) surveillance of white-tailed deer (Odocoileus virginianus) populations in select Michigan Counties. New regions can be readily added, also the model can be readily adapted for other disease systems and used for informed-decision making during planning and implementation stages of disease surveillance in wildlife and free-ranging species.
Non-attentional visual information transmission in groups under predation
J. Fransje Weerden, van | Published Wednesday, March 25, 2020Our aim is to show effects of group living when only low-level cognition is assumed, such as pattern recognition needed for normal functioning, without assuming individuals have knowledge about others around them or warn them actively.
The model is of a group of vigilant foragers staying within a patch, under attack by a predator. The foragers use attentional scanning for predator detection, and flee after detection. This fleeing action constitutes a visual cue to danger, and can be received non-attentionally by others if it occurs within their limited visual field. The focus of this model is on the effectiveness of this non-attentional visual information reception.
A blind angle obstructing cue reception caused by behaviour can exist in front, morphology causes a blind angle in the back. These limitations are represented by two visual field shapes. The scan for predators is all-around, with distance-dependent detection; reception of flight cues is limited by visual field shape.
Initial parameters for instance: group sizes, movement, vision characteristics for predator detection and for cue reception. Captures (failure), number of times the information reached all individuals at the same time (All-fled, success), and several other effects of the visual settings are recorded.
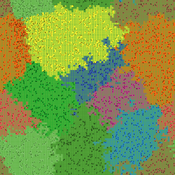
Peer reviewed Lethal Geometry
Kristin Crouse | Published Friday, February 21, 2020 | Last modified Wednesday, December 15, 2021LethalGeometry was developed to examine whether territory size influences the mortality risk for individuals within that territory. For animals who live in territoral groups and are lethally aggressive, we can expect that most aggression occurs along the periphery (or border) between two adjacent territories. For territories that are relatively large, the periphery makes up a proportionately small amount of the of the total territory size, suggesting that individuals in these territories might be less likely to die from these territorial skirmishes. LethalGeometry examines this geometric relationship between territory size and mortality risk under realistic assumptions of variable territory size and shape, variable border width, and stochastic interactions and movement.
The individuals (agents) are programmed to walk randomly about their environment, search for and eat food to obtain energy, reproduce if they can, and act aggressively toward individuals of other groups. During each simulation step, individuals analyze their environment and internal state to determine which actions to take. The actions available to individuals include moving, fighting, and giving birth.
A Bottom-Up Simulation on Competition and Displacement of Online Interpersonal Communication Platforms
great-sage-futao | Published Tuesday, December 31, 2019 | Last modified Tuesday, December 31, 2019This model aims to simulate Competition and Displacement of Online Interpersonal Communication Platforms process from a bottom-up angle. Individual interpersonal communication platform adoption and abandonment serve as the micro-foundation of the simulation model. The evolution mode of platform user online communication network determines how present platform users adjust their communication relationships as well as how new users join that network. This evolution mode together with innovations proposed by individual interpersonal communication platforms would also have impacts on the platform competition and displacement process and result by influencing individual platform adoption and abandonment behaviors. Three scenes were designed to simulate some common competition situations occurred in the past and current time, that two homogeneous interpersonal communication platforms competed with each other when this kind of platforms first came into the public eye, that a late entrant platform with a major innovation competed with the leading incumbent platform during the following days, as well as that both the leading incumbent and the late entrant continued to propose many small innovations to compete in recent days, respectively.
Initial parameters are as follows: n(Nmax in the paper), denotes the final node number of the online communication network node. mi (m in the paper), denotes the initial degree of those initial network nodes and new added nodes. pc(Pc in the paper), denotes the proportion of links to be removed and added in each epoch. pst(Pv in the paper), denotes the proportion of nodes with a viscosity to some platforms. comeintime(Ti in the paper), denotes the epoch when Platform 2 joins the market. pit(Pi in the paper), denotes the proportion of nodes adopting Platform 2 immediately at epoch comeintime(Ti). ct(Ct in the paper), denotes the Innovation Effective Period length. In Scene 2, There is only one major platform proposed by Platform 2, and ct describes that length. However, in Scene 3, Platform 2 and 1 will propose innovations alternately. And so, we set ct=10000 in simulation program, and every jtt epochs, we alter the innovation proposer from one platform to the other. Hence in this scene, jtt actually denotes the Innovation Effective Period length instead of ct.
Prisoner's Tournament
Kristin Crouse | Published Wednesday, November 06, 2019 | Last modified Wednesday, December 15, 2021This model replicates the Axelrod prisoner’s dilemma tournaments. The model takes as input a file of strategies and pits them against each other to see who achieves the best payoff in the end. Change the payoff structure to see how it changes the tournament outcome!
The Hawk-Dove Game
Kristin Crouse | Published Tuesday, November 05, 2019This model simulates the Hawk-Dove game as first described by John Maynard Smith, and further elaborated by Richard Dawkins in “The Selfish Gene”. In the game, two strategies, Hawks and Doves, compete against each other, and themselves, for reproductive benefits. A third strategy can be introduced, Retaliators, which act like either Hawks or Doves, depending on the context.
Displaying 10 of 226 results other clear search