About the CoMSES Model Library more info
Our mission is to help computational modelers at all levels engage in the establishment and adoption of community standards and good practices for developing and sharing computational models. Model authors can freely publish their model source code in the Computational Model Library alongside narrative documentation, open science metadata, and other emerging open science norms that facilitate software citation, reproducibility, interoperability, and reuse. Model authors can also request peer review of their computational models to receive a DOI.
All users of models published in the library must cite model authors when they use and benefit from their code.
Please check out our model publishing tutorial and contact us if you have any questions or concerns about publishing your model(s) in the Computational Model Library.
We also maintain a curated database of over 7500 publications of agent-based and individual based models with additional detailed metadata on availability of code and bibliometric information on the landscape of ABM/IBM publications that we welcome you to explore.
Displaying 10 of 17 results managers clear search
Peer reviewed Street Dog Sim - An agent based model for investigating strategies of free roaming dog control.
Andrew Calinger-yoak | Published Wednesday, July 19, 2023This is an agent-based model constructed in Netlogo v6.2.2 which seeks to provide a simple but flexible tool for researchers and dog-population managers to help inform management decisions.
It replicates the basic demographic processes including:
* reproduction
* natural death
* dispersal
…
The S-uFUNK Model
Davide Secchi | Published Friday, March 17, 2023This version 2.1.0 of the uFunk model is about setting a business strategy (the S in the name) for an organization. A team of managers (or executives) meet and discuss various options on the strategy for the firm. There are three aspects that they have to agree on to set the strategic positioning of the organization.
The discussion is on market, stakeholders, and resources. The team (it could be a business strategy task force) considers various aspects of these three elements. The resources they use to develop the discussion can come from a traditional approach to strategy or from non-traditional means (e.g., so-called serious play, creativity and imagination techniques).
The S-uFunk 2.1.0 Model wants to understand to which extent cognitive means triggered by traditional and non-traditional resources affect the making of the strategy process.
Peer reviewed Personnel decisions in the hierarchy
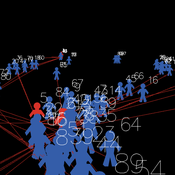
Smarzhevskiy Ivan | Published Friday, August 19, 2022This is a model of organizational behavior in the hierarchy in which personnel decisions are made.
The idea of the model is that the hierarchy, busy with operations, is described by such characteristics as structure (number and interrelation of positions) and material, filling these positions (persons with their individual performance). A particular hierarchy is under certain external pressure (performance level requirement) and is characterized by the internal state of the material (the distribution of the perceptions of others over the ensemble of persons).
The World of the model is a four-level hierarchical structure, consisting of shuff positions of the top manager (zero level of the hierarchy), first-level managers who are subordinate to the top manager, second-level managers (subordinate to the first-level managers) and positions of employees (the third level of the hierarchy). ) subordinated to the second-level managers. Such a hierarchy is a tree, i.e. each position, with the exception of the position of top manager, has a single boss.
Agents in the model are persons occupying the specified positions, the number of persons is set by the slider (HumansQty). Personas have some operational performance (harisma, an unfortunate attribute name left over from the first edition of the model)) and a sense of other personas’ own perceptions. Performance values are distributed over the ensemble of persons according to the normal law with some mean value and variance.
The value of perception by agents of each other is positive or negative (implemented in the model as numerical values equal to +1 and -1). The distribution of perceptions over an ensemble of persons is implemented as a random variable specified by the probability of negative perception, the value of which is set by the control elements of the model interface. The numerical value of the probability equal to 0 corresponds to the case in which all persons positively perceive each other (the numerical value of the random variable is equal to 1, which corresponds to the positive perception of the other person by the individual).
The hierarchy is occupied with operational activity, the degree of intensity of which is set by the external parameter Difficulty. The level of productivity of each manager OAIndex is equal to the level of productivity of the department he leads and is the ratio of the sum of productivity of employees subordinate to the head to the level of complexity of the work Difficulty. An increase in the numerical value of Difficulty leads to a decrease in the OAIndex for all subdivisions of the hierarchy. The managerial meaning of the OAIndex indicator is the percentage of completion of the load specified for the hierarchy as a whole, i.e. the ratio of the actual performance of the structural subdivisions of the hierarchy to the required performance, the level of which is specified by the value of the Difficulty parameter.
…
Model of communication between two groups of managers in the course of project implementation
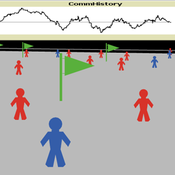
Smarzhevskiy Ivan | Published Monday, December 07, 2020This is a simulation model of communication between two groups of managers in the course of project implementation. The “world” of the model is a space of interaction between project participants, each of which belongs either to a group of work performers or to a group of customers. Information about the progress of the project is publicly available and represents the deviation Earned value (EV) from the planned project value (cost baseline).
The key elements of the model are 1) persons belonging to a group of customers or performers, 2) agents that are communication acts. The life cycle of persons is equal to the time of the simulation experiment, the life cycle of the communication act is 3 periods of model time (for the convenience of visualizing behavior during the experiment). The communication act occurs at a specific point in the model space, the coordinates of which are realized as random variables. During the experiment, persons randomly move in the model space. The communication act involves persons belonging to a group of customers and a group of performers, remote from the place of the communication act at a distance not exceeding the value of the communication radius (MaxCommRadius), while at least one representative from each of the groups must participate in the communication act. If none are found, the communication act is not carried out. The number of potential communication acts per unit of model time is a parameter of the model (CommPerTick).
The managerial sense of the feedback is the stimulating effect of the positive value of the accumulated communication complexity (positive background of the project implementation) on the productivity of the performers. Provided there is favorable communication (“trust”, “mutual understanding”) between the customer and the contractor, it is more likely that project operations will be performed with less lag behind the plan or ahead of it.
The behavior of agents in the world of the model (change of coordinates, visualization of agents’ belonging to a specific communicative act at a given time, etc.) is not informative. Content data are obtained in the form of time series of accumulated communicative complexity, the deviation of the earned value from the planned value, average indicators characterizing communication - the total number of communicative acts and the average number of their participants, etc. These data are displayed on graphs during the simulation experiment.
The control elements of the model allow seven independent values to be varied, which, even with a minimum number of varied values (three: minimum, maximum, optimum), gives 3^7 = 2187 different variants of initial conditions. In this case, the statistical processing of the results requires repeated calculation of the model indicators for each grid node. Thus, the set of varied parameters and the range of their variation is determined by the logic of a particular study and represents a significant narrowing of the full set of initial conditions for which the model allows simulation experiments.
…
An agent-based model of building occupant behavior during load shedding
Handi Chandra Putra | Published Thursday, May 21, 2020Load shedding enjoys increasing popularity as a way to reduce power consumption in buildings during hours of peak demand on the electricity grid. This practice has well known cost saving and reliability benefits for the grid, and the contracts utilities sign with their “interruptible” customers often pass on substantial electricity cost savings to participants. Less well-studied are the impacts of load shedding on building occupants, hence this study investigates those impacts on occupant comfort and adaptive behaviors. It documents experience in two office buildings located near Philadelphia (USA) that vary in terms of controllability and the set of adaptive actions available to occupants. An agent-based model (ABM) framework generalizes the case-study insights in a “what-if” format to support operational decision making by building managers and tenants. The framework, implemented in EnergyPlus and NetLogo, simulates occupants that have heterogeneous
thermal and lighting preferences. The simulated occupants pursue local adaptive actions such as adjusting clothing or using portable fans when central building controls are not responsive, and experience organizational constraints, including a corporate dress code and miscommunication with building managers. The model predicts occupant decisions to act fairly well but has limited ability to predict which specific adaptive actions occupants will select.
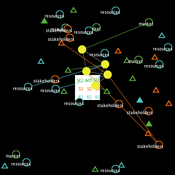
Managing networked landscapes: conservation in fragmented, regionally connected world
Jacopo A. Baggio Michael Schoon Sechindra Vallury | Published Monday, December 09, 2019Exploring how learning and social-ecological networks influence management choice set and their ability to increase the likelihood of species coexistence (i.e. biodiversity) on a fragmented landscape controlled by different managers.
Simulating Water, Individuals, and Management (SWIM)
John Murphy | Published Friday, July 05, 2019SWIM is a simulation of water management, designed to study interactions among water managers and customers in Phoenix and Tucson, Arizona. The simulation can be used to study manager interaction in Phoenix, manager and customer messaging and water conservation in Tucson, and when coupled to the Water Balance Model (U New Hampshire), impacts of management and consumer choices on regional hydrology.
Publications:
Murphy, John T., Jonathan Ozik, Nicholson T. Collier, Mark Altaweel, Richard B. Lammers, Alexander A. Prusevich, Andrew Kliskey, and Lilian Alessa. “Simulating Regional Hydrology and Water Management: An Integrated Agent-Based Approach.” Winter Simulation Conference, Huntington Beach, CA, 2015.
Peer reviewed Organizational behavior in the hierarchy model
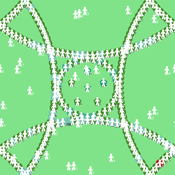
Smarzhevskiy Ivan | Published Tuesday, June 18, 2019 | Last modified Wednesday, July 31, 2019In a two-level hierarchical structure (consisting of the positions of managers and operators), persons holding these positions have a certain performance and the value of their own (personal perception in this, simplified, version of the model) perception of each other. The value of the perception of each other by agents is defined as a random variable that has a normal distribution (distribution parameters are set by the control elements of the interface).
In the world of the model, which is the space of perceptions, agents implement two strategies: rapprochement with agents that perceive positively and distance from agents that perceive negatively (both can be implemented, one of these strategies, or neither, the other strategy, which makes the agent stationary). Strategies are implemented in relation to those agents that are in the radius of perception (PerRadius).
The manager (Head) forms a team of agents. The performance of the group (the sum of the individual productivities of subordinates, weighted by the distance from the leader) varies depending on the position of the agents in space and the values of their individual productivities. Individual productivities, in the current version of the model, are set as a random variable distributed evenly on a numerical segment from 0 to 100. The manager forms the team 1) from agents that are in (organizational) radius (Op_Radius), 2) among agents that the manager perceives positively and / or negatively (both can be implemented, one of the specified rules, or neither, which means the refusal of the command formation).
Agents can (with a certain probability, given by the variable PrbltyOfDecisn%), in case of a negative perception of the manager, leave his group permanently.
It is possible in the model to change on the fly radii values, update the perception value across the entire population and the perception of an individual agent by its neighbors within the perception radius, and the probability values for a subordinate to make a decision about leaving the group.
You can also change the set of strategies for moving agents and strategies for recruiting a team manager. It is possible to add a randomness factor to the movement of agents (Stoch_Motion_Speed, the default is set to 0, that is, there are no random movements).
…
How does knowledge infrastructure mobilization influence the safe operating space of regulated exploited ecosystems?
Jean-Denis Mathias | Published Tuesday, July 17, 2018Decision-makers often have to act before critical times to avoid the collapse of ecosystems using knowledge \textcolor{red}{that can be incomplete or biased}. Adaptive management may help managers tackle such issues. However, because the knowledge infrastructure required for adaptive management may be mobilized in several ways, we study the quality and the quantity of knowledge provided by this knowledge infrastructure. In order to analyze the influence of mobilized knowledge, we study how the following typology of knowledge and its use may impact the safe operating space of exploited ecosystems: 1) knowledge of the past based on a time series distorted by measurement errors; 2) knowledge of the current systems’ dynamics based on the representativeness of the decision-makers’ mental models of the exploited ecosystem; 3) knowledge of future events based on decision-makers’ likelihood estimates of extreme events based on modeling infrastructure (models and experts to interpret them) they have at their disposal. We consider different adaptive management strategies of a general regulated exploited ecosystem model and we characterize the robustness of these strategies to biased knowledge. Our results show that even with significant mobilized knowledge and optimal strategies, imperfect knowledge may still shrink the safe operating space of the system leading to the collapse of the system. However, and perhaps more interestingly, we also show that in some cases imperfect knowledge may unexpectedly increase the safe operating space by suggesting cautious strategies.
The code enables to calculate the safe operating spaces of different managers in the case of biased and unbiased knowledge.

Team Problem Solving and Motivation under Disorganization
Dinuka Herath | Published Sunday, August 13, 2017The model combines the two elements of disorganization and motivation to explore their impact on teams. Effects of disorganization on team task performance (problem solving)
Displaying 10 of 17 results managers clear search