About the CoMSES Model Library more info
Our mission is to help computational modelers develop, document, and share their computational models in accordance with community standards and good open science and software engineering practices. Model authors can publish their model source code in the Computational Model Library with narrative documentation as well as metadata that supports open science and emerging norms that facilitate software citation, computational reproducibility / frictionless reuse, and interoperability. Model authors can also request private peer review of their computational models. Models that pass peer review receive a DOI once published.
All users of models published in the library must cite model authors when they use and benefit from their code.
Please check out our model publishing tutorial and feel free to contact us if you have any questions or concerns about publishing your model(s) in the Computational Model Library.
We also maintain a curated database of over 7500 publications of agent-based and individual based models with detailed metadata on availability of code and bibliometric information on the landscape of ABM/IBM publications that we welcome you to explore.
Displaying 10 of 867 results for "Jes%C3%BAs M Zamarre%C3%B1o" clear search
Peer reviewed CHIME ABM of Hurricane Evacuation
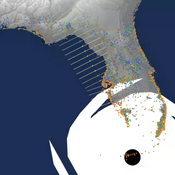
C Michael Barton Sean Bergin Joshua Watts Joshua Alland Rebecca Morss | Published Monday, October 18, 2021 | Last modified Tuesday, January 04, 2022The Communicating Hazard Information in the Modern Environment (CHIME) agent-based model (ABM) is a Netlogo program that facilitates the analysis of information flow and protective decisions across space and time during hazardous weather events. CHIME ABM provides a platform for testing hypotheses about collective human responses to weather forecasts and information flow, using empirical data from historical hurricanes. The model uses real world geographical and hurricane data to set the boundaries of the simulation, and it uses historical hurricane forecast information from the National Hurricane Center to initiate forecast information flow to citizen agents in the model.
Urban Teacher Lifecycle and Mobility
Yevgeny Patarakin | Published Wednesday, July 23, 2025This agent-based model simulates the lifecycle, movement, and satisfaction of teachers within an urban educational system composed of multiple universities and schools. Each teacher agent transitions through several possible roles: newcomer, university student, unemployed graduate, and employed teacher. Teachers’ pathways are shaped by spatial configuration, institutional capacities, individual characteristics, and dynamic interactions with schools and universities. Universities are assigned spatial locations with a controllable level of centralization and are characterized by academic ratings, capacity, and alumni records. Schools are distributed throughout the city, each with a limited number of vacancies, hiring requirements, and offered salaries. Teachers apply to universities based on the alignment of their personal academic profiles with institutional ratings, pursue studies, and upon graduation become candidates for employment at schools.
The employment process is driven by a decentralized matching of teacher expectations and school offers, taking into account factors such as salary, proximity, and peer similarity. Teachers’ satisfaction evolves over time, reflecting both institutional characteristics and the composition of their colleagues; low satisfaction may prompt teachers to transfer between schools within their mobility radius. Mortality and teacher attrition further shape workforce dynamics, leading to continuous recruitment of newcomers to maintain a stable population. The model tracks university reputation through the academic performance and number of alumni, and visualizes key metrics including teacher status distribution, school staffing, university alumni counts, and overall satisfaction. This structure enables the exploration of policy interventions, hiring and training strategies, and the impact of spatial and institutional design on the allocation, retention, and happiness of urban educational staff.
Exploring the Potential of Conversational AI Support for Agent-Based Social Simulation Model Design
Peer-Olaf Siebers | Published Sunday, May 12, 2024Our aim is to demonstrate how conversational AI systems, exemplified by ChatGPT, can support the conceptualisation of Agent-Based Social Simulation (ABSS) models, leading to a full ABSS model design document. Through advanced prompt engineering and adherence to the Engineering ABSS framework (Siebers and Klügl 2017), we have constructed a comprehensive script that is easy to use and that supports the design of ABSS models with or even by AI. The performance of the script is demonstrated through an illustrative case study related to the use of adaptive architecture in museums. The repository contains (1) the comprehensive script in a format that allows copying and pasting prompts for use with ChatGPT, (2) the results of the illustrative case study in the form of two conceptual ABSS models, the ground truth and the autogenerated version.
Modeling the Emergence of Riots
Andrew Crooks Bianica Pires | Published Wednesday, January 20, 2016 | Last modified Wednesday, September 21, 2016The purpose of the model is to explore how the unique socioeconomic variables underlying Kibera, local interactions, and the spread of a rumor, may trigger a riot.
NarrABS
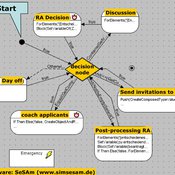
Tilman Schenk | Published Thursday, September 20, 2012 | Last modified Saturday, April 27, 2013An agent based simulation of a political process based on stakeholder narratives
Optimal Trading Strategies of Agents in a Population of Firms: An Agent-Based Approach to Soccer Transfer Markets
Kehinde Salau | Published Tuesday, December 16, 2008 | Last modified Saturday, April 27, 2013Default Initial skill, read ODD for more info. The purpose of the model presented by Salau is to study the ’player profit vs. club benefit’ dilemma present in professional soccer organizations.
Peer reviewed Dawkins Weasel
Kristin Crouse | Published Thursday, February 08, 2018 | Last modified Wednesday, January 28, 2026Dawkins’ Weasel is a NetLogo model that illustrates the principle of evolution by natural selection. It is inspired by a thought experiment presented by Richard Dawkins in his book The Blind Watchmaker (1996).
Schelling Model of the City of Salzburg
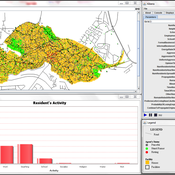
Andreas Schlagbauer | Published Monday, December 05, 2022The purpose of the model is to better understand, how different factors for human residential choices affect the city’s segregation pattern. Therefore, a Schelling (1971) model was extended to include ethnicity, income, and affordability and applied to the city of Salzburg. So far, only a few studies have tried to explore the effect of multiple factors on the residential pattern (Sahasranaman & Jensen, 2016, 2018; Yin, 2009). Thereby, models using multiple factors can produce more realistic results (Benenson et al., 2002). This model and the corresponding thesis aim to fill that gap.
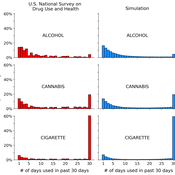
A simple computational algorithm for simulating population substance use
Jacob Borodovsky | Published Thursday, March 27, 2025This code simulates individual-level, longitudinal substance use patterns that can be used to understand how cross-sectional U-shaped distributions of population substance use emerge. Each independent computational object transitions between two states: using a substance (State 1), or not using a substance (State 2). The simulation has two core components. Component 1: each object is assigned a unique risk factor transition probability and unique protective factor transition probability. Component 2: each object’s current decision to use or not use the substance is influenced by the object’s history of decisions (i.e., “path dependence”).
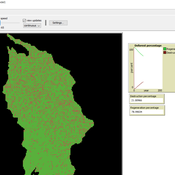
Peer reviewed Deforestation
MohammadAli Aghajani | Published Saturday, January 20, 2024 | Last modified Thursday, August 14, 2025Deforestation Simulation Model in NetLogo with GIS Layers
This model has developed in Netlogo software and utilizes
the GIS extension.
This NetLogo-based agent-based model (ABM) simulates deforestation dynamics using the GIS extension. It incorporates parameters like wood extraction, forest regeneration, agricultural expansion, and livestock impact. The model integrates spatial layers, including forest areas, agriculture zones, rural settlements, elevation, slope, and livestock distribution. Outputs include real-time graphical representations of forest loss, regeneration, and land-use changes. This model helps analyze deforestation patterns and conservation strategies using ABM and GIS.
Displaying 10 of 867 results for "Jes%C3%BAs M Zamarre%C3%B1o" clear search