Our mission is to help computational modelers develop, document, and share their computational models in accordance with community standards and good open science and software engineering practices. Model authors can publish their model source code in the Computational Model Library with narrative documentation as well as metadata that supports open science and emerging norms that facilitate software citation, computational reproducibility / frictionless reuse, and interoperability. Model authors can also request private peer review of their computational models. Models that pass peer review receive a DOI once published.
All users of models published in the library must cite model authors when they use and benefit from their code.
Please check out our model publishing tutorial and feel free to contact us if you have any questions or concerns about publishing your model(s) in the Computational Model Library.
Displaying 10 of 526 results for "Tim M Daw" clear search
TechNet_04: Cultural Transmission in a Spatially-Situated Network
Andrew White | Published Monday, October 08, 2012 | Last modified Saturday, April 27, 2013The TechNet_04 is an abstract model that embeds a simple cultural tranmission process in an environment where interaction is structured by spatially-situated networks.
Role of Diversity in Team Performance: the Case of Missing Expertise, an Agent Based Simulations
Tamás Kiss | Published Friday, December 29, 2023This ABM simulates problem solving agents as they work on a set of tasks. Each agent has a trait vector describing their skills. Two agents might form a collaboration if their traits are similar enough. Tasks are defined by a component vector. Agents work on tasks by decreasing tasks’ component vectors towards zero.
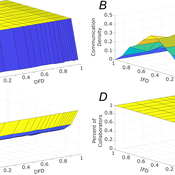
The simulation generates agents with given intrapersonal functional diversity (IFD), and dominant function diversity (DFD), and a set of random tasks and evaluates how agents’ traits influence their level of communication and the performance of a team of agents.
Modeling results highlight the importance of the distributions of agents’ properties forming a team, and suggests that for a thorough description of management teams, not only diversity measures based on individual agents, but an aggregate measure is also required.
…
LogoClim: WorldClim in NetLogo
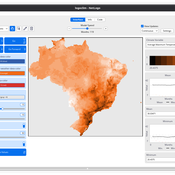
Daniel Vartanian Leandro Garcia Aline Martins de Carvalho Aline | Published Thursday, July 03, 2025 | Last modified Monday, July 13, 2026LogoClim is a NetLogo model designed to be integrated into other simulations through the LevelSpace extension (Hjorth et al., 2020), providing high resolution climate data from sources validated and used by the Intergovernmental Panel on Climate Change (IPCC).
The model simplifies and standardizes the integration of climate data into NetLogo, allowing researchers to focus their efforts on the model itself with the assurance of using reliable and widely recognized data. Although its main use is as a component of larger simulations, LogoClim also has its own graphical interface for monitoring and checking the datasets.
The climate data comes from the WorldClim 2.1 project (Fick & Hijmans, 2017), for which LogoClim works as an interface to NetLogo. The model supports all three WorldClim data series: (1) Historical Climate Data (1970 to 2000), with 12 monthly points for minimum, mean, and maximum temperature, precipitation, solar radiation, wind speed, vapor pressure, elevation, and bioclimatic variables; (2) Historical Monthly Weather Data (1951 to 2024), based on downscaling of CRU-TS-4.09, developed by the Climatic Research Unit at the University of East Anglia (Harris et al., 2020), with minimum and maximum temperature and total precipitation; and (3) Future Climate Data, based on downscaling climate projections derived from global climate models of the Coupled Model Intercomparison Project Phase 6 (CMIP6) (Eyring et al., 2016) for four future periods (2021 to 2040, 2041 to 2060, 2061 to 2080, and 2081 to 2100) and four scenarios based on the Shared Socioeconomic Pathways (SSPs 126, 245, 370, and 585), covering minimum and maximum temperature, total precipitation, and bioclimatic variables. All series are available at multiple spatial resolutions, from 10 minutes (about 340 km² at the equator) to 30 seconds (about 1 km² at the equator).
…

Soil microbe-predator model with enzymes
Randall Boone John C Moore Akihiro Koyama Kirstin Holfelder | Published Thursday, November 21, 2013We seek to improve understanding of roles enzyme play in soil food webs. We created an agent-based simulation of a simple food web that includes enzymatic activity. The model was used in a publication, Moore et al. (in press; Biochemistry).
Informal risk-sharing cooperatives : ORP and Learning
Juliette Rouchier Victorien Barbet Renaud Bourlès | Published Monday, February 13, 2017 | Last modified Tuesday, May 16, 2023The model studies the dynamics of risk-sharing cooperatives among heterogeneous farmers. Based on their knowledge on their risk exposure and the performance of the cooperative farmers choose whether or not to remain in the risk-sharing agreement.
Impact of topography and climate change on Magdalenian social networks
Claudine Gravel-Miguel | Published Monday, September 11, 2017The model presented here was created as part of my dissertation. It aims to study the impacts of topography and climate change on prehistoric networks, with a focus on the Magdalenian, which is dated to between 20 and 14,000 years ago.
Hybrid Climate Assessment Model (HCAM)
Peer-Olaf Siebers | Published Friday, February 15, 2019Our Hybrid Climate Assessment Model (HCAM) aims to simulate the behaviours of individuals under the influence of climate change and external policy makings. In our proposed solution we use System Dynamics (SD) modelling to represent the physical and economic environments. Agent-Based (AB) modelling is used to represent collections of individuals that can interact with other collections of individuals and the environment. In turn, individual agents are endowed with an internal SD model to track their psychological state used for decision making. In this paper we address the feasibility of such a scalable hybrid approach as a proof-of-concept. This novel approach allows us to reuse existing rigid, but well-established Integrated Assessment Models (IAMs), and adds more flexibility by replacing aggregate stocks with a community of vibrant interacting entities.
Our illustrative example takes the settings of the U.S., a country that contributes to the majority of the global carbon footprints and that is the largest economic power in the world. The model considers the carbon emission dynamics of individual states and its relevant economic impacts on the nation over time.
Please note that the focus of the model is on a methodological advance rather than on applying it for predictive purposes! More details about the HCAM are provided in the forthcoming JASSS paper “An Innovative Approach to Multi-Method Integrated Assessment Modelling of Global Climate Change”, which is available upon request from the authors (contact [email protected]).
Telephone Game
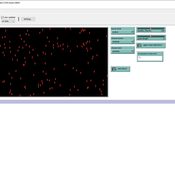
Julia Kasmire | Published Friday, January 10, 2020This is a model of a game of Telephone (also known as Chinese Whishpers in the UK), with agents representing people that can be asked, to play. The first player selects a word from their internal vocabulary and “whispers” it to the next player, who may mishear it depending on the current noise level, who whispers that word to the next player, and so on.
When the game ends, the word chosen by the first player is compared to the word heard by the last player. If they match exactly, all players earn large prize. If the words do not match exactly, a small prize is awarded to all players for each part of the words that do match. Players change color to reflect their current prize-count. A histogram shows the distribution of colors over all the players.
The user can decide on factors like
* how many players there are,
…
Risk-Sharing under Heterogeneity: NetLogo simulation
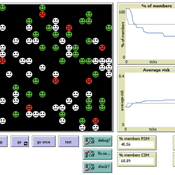
Eva Vriens | Published Monday, February 28, 2022Motivated by the emergence of new Peer-to-Peer insurance organizations that rethink how insurance is organized, we propose a theoretical model of decision-making in risk-sharing arrangements with risk heterogeneity and incomplete information about the risk distribution as core features. For these new, informal organisations, the available institutional solutions to heterogeneity (e.g., mandatory participation or price differentiation) are either impossible or undesirable. Hence, we need to understand the scope conditions under which individuals are motivated to participate in a bottom-up risk-sharing setting. The model puts forward participation as a utility maximizing alternative for agents with higher risk levels, who are more risk averse, are driven more by solidarity motives, and less susceptible to cost fluctuations. This basic micro-level model is used to simulate decision-making for agent populations in a dynamic, interdependent setting. Simulation results show that successful risk-sharing arrangements may work if participants are driven by motivations of solidarity or risk aversion, but this is less likely in populations more heterogeneous in risk, as the individual motivations can less often make up for the larger cost deficiencies. At the same time, more heterogeneous groups deal better with uncertainty and temporary cost fluctuations than more homogeneous populations do. In the latter, cascades following temporary peaks in support requests more often result in complete failure, while under full information about the risk distribution this would not have happened.
SimPioN - Simulating Path dependence in inter-organisational Networks
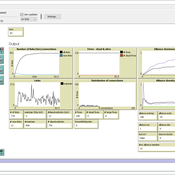
Nanda Wijermans Frithjof Stöppler | Published Monday, January 11, 2021The SimPioN model aims to abstractly reproduce and experiment with the conditions under which a path-dependent process may lead to a (structural) network lock-in in interorganisational networks.
Path dependence theory is constructed around a process argumentation regarding three main elements: a situation of (at least) initially non-ergodic (unpredictable with regard to outcome) starting conditions in a social setting; these become reinforced by the workings of (at least) one positive feedback mechanism that increasingly reduces the scope of conceivable alternative choices; and that process finally results in a situation of lock-in, where any alternatives outside the already adopted options become essentially impossible or too costly to pursue despite (ostensibly) better options theoretically being available.
The purpose of SimPioN is to advance our understanding of lock-ins arising in interorganisational networks based on the network dynamics involving the mechanism of social capital. This mechanism and the lock-ins it may drive have been shown above to produce problematic consequences for firms in terms of a loss of organisational autonomy and strategic flexibility, especially in high-tech knowledge-intensive industries that rely heavily on network organising.
…
Displaying 10 of 526 results for "Tim M Daw" clear search