About the CoMSES Model Library more info
Our mission is to help computational modelers develop, document, and share their computational models in accordance with community standards and good open science and software engineering practices. Model authors can publish their model source code in the Computational Model Library with narrative documentation as well as metadata that supports open science and emerging norms that facilitate software citation, computational reproducibility / frictionless reuse, and interoperability. Model authors can also request private peer review of their computational models. Models that pass peer review receive a DOI once published.
All users of models published in the library must cite model authors when they use and benefit from their code.
Please check out our model publishing tutorial and feel free to contact us if you have any questions or concerns about publishing your model(s) in the Computational Model Library.
We also maintain a curated database of over 7500 publications of agent-based and individual based models with detailed metadata on availability of code and bibliometric information on the landscape of ABM/IBM publications that we welcome you to explore.
Displaying 10 of 349 results for "Miriam C. Kopels" clear search
Gender differentiation model
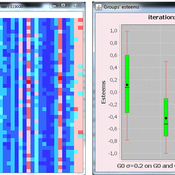
Sylvie Huet | Published Monday, April 20, 2020 | Last modified Thursday, April 23, 2020This is a gender differentiation model in terms of reputations, prestige and self-esteem (presented in the paper https://journals.plos.org/plosone/article?id=10.1371/journal.pone.0236840). The model is based on the influence function of the Leviathan model (Deffuant, Carletti, Huet 2013 and Huet and Deffuant 2017) considering two groups.
This agent-based model studies how inequalities can be explained by the difference of open-mindness between two groups of interacting agents. We consider agents having an opinion/esteem about each other and about themselves. During dyadic meetings, agents change their respective opinion about each other and possibly about other agents they gossip about, with a noisy perception of the opinions of their interlocutor. Highly valued agents are more influential in such encounters. We study an heterogeneous population of two different groups: one more open to influence of others, taking less into account their perceived difference of esteem, called L; a second one less prone to it, called S, who designed the credibility they give to others strongly based on how higher or lower valued than themselves they perceive them.
We show that a mixed population always turns in favor to some agents belonging to the group of less open-minded agents S, and harms the other group: (1) the average group self-opinion or reputation of S is always better than the one of L; (2) the higher rank in terms of reputation are more frequently occupied by the S agents while the L agents occupy more the bottom rank; (3) the properties of the dynamics of differentiation between the two groups are similar to the properties of the glass ceiling effect proposed by Cotter et al (2001).
ABM for Underwater optical wireless communication in a water tank
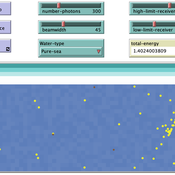
Mohamed ABID | Published Sunday, May 29, 2022This model simulates the propagation of photons in a water tank. A source of light emits an impulse of photons with equal energy represented by yellow dots. These photons are then scattered by water particles before possibly reaching the photo-detector represented by a gray line. Different types of water are considered. For each one of them we calculate the total received energy.
The water tank is represented by a blue rectangle with fixed dimensions. It’s exposed to the air interface and has totally absorbent barriers. Four types of water are supported. Each one is characterized by its absorption and scattering coefficients.
At the source, the photons are generated uniformly with a random direction within the beamwidth. Each photon travels a random distance drawn from a distribution depending on the water characteristics before encountering a water particle.
Based on the updated position of the photon, three situations may occur:
-The photon hits the barrier of the tank on its trajectory. In this case it’s considered as lost since the barriers are assumed totally absorbent.
…
Peer reviewed Avian pest control: Yield outcome due to insectivorous birds, falconry, and integration of nest boxes.
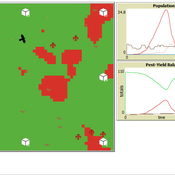
David Jung | Published Monday, November 13, 2023 | Last modified Sunday, November 19, 2023The model aims to simulate predator-prey relationships in an agricultural setting. The focus lies on avian communities and their effect on different pest organisms (here: pest birds, rodents, and arthropod pests). Since most case studies focused on the impact on arthropod pests (AP) alone, this model attempts to include effects on yield outcome. By incorporating three treatments with different factor levels (insectivorous bird species, falconry, nest box density) an experimental setup is given that allows for further statistical analysis to identify an optimal combination of the treatments.
In light of a global decline of birds, insects, and many other groups of organisms, alternative practices of pest management are heavily needed to reduce the input of pesticides. Avian pest control therefore poses an opportunity to bridge the disconnect between humans and nature by realizing ecosystem services and emphasizing sustainable social ecological systems.
Peer reviewed SequiaBasalto model
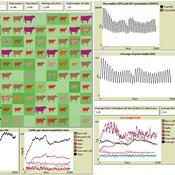
Marco Janssen Irene Perez Ibarra Pierre Bommel Diego J. Soler-Navarro Alicia Tenza Peral Francisco Dieguez Cameroni | Published Friday, May 26, 2023This is a replication of the SequiaBasalto model, originally built in Cormas by Dieguez Cameroni et al. (2012, 2014, Bommel et al. 2014 and Morales et al. 2015). The model aimed to test various adaptations of livestock producers to the drought phenomenon provoked by climate change. For that purpose, it simulates the behavior of one livestock farm in the Basaltic Region of Uruguay. The model incorporates the price of livestock, fodder and paddocks, as well as the growth of grass as a function of climate and seasons (environmental submodel), the life cycle of animals feeding on the pasture (livestock submodel), and the different strategies used by farmers to manage their livestock (management submodel). The purpose of the model is to analyze to what degree the common management practices used by farmers (i.e., proactive and reactive) to cope with seasonal and interannual climate variations allow to maintain a sustainable livestock production without depleting the natural resources (i.e., pasture). Here, we replicate the environmental and livestock submodel using NetLogo.
One year is 368 days. Seasons change every 92 days. Each day begins with the growth of grass as a function of climate and season. This is followed by updating the live weight of cows according to the grass height of their patch, and grass consumption, which is determined based on the updated live weight. After consumption, cows grow and reproduce, and a new grass height is calculated. Cows then move to the patch with less cows and with the highest grass height. This updated grass height value will be the initial grass height for the next day.
Peer reviewed A financial market with zero intelligence agents
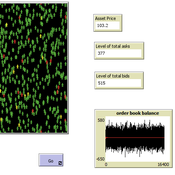
edgarkp | Published Wednesday, March 27, 2024The model’s aim is to represent the price dynamics under very simple market conditions, given the values adopted by the user for the model parameters. We suppose the market of a financial asset contains agents on the hypothesis they have zero-intelligence. In each period, a certain amount of agents are randomly selected to participate to the market. Each of these agents decides, in a equiprobable way, between proposing to make a transaction (talk = 1) or not (talk = 0). Again in an equiprobable way, each participating agent decides to speak on the supply (ask) or the demand side (bid) of the market, and proposes a volume of assets, where this number is drawn randomly from a uniform distribution. The granularity depends on various factors, including market conventions, the type of assets or goods being traded, and regulatory requirements. In some markets, high granularity is essential to capture small price movements accurately, while in others, coarser granularity is sufficient due to the nature of the assets or goods being traded
Sensitivity of the Deffuant model to measurement error
Dino Carpentras | Published Monday, June 07, 2021This code can be used to analyze the sensitivity of the Deffuant model to different measurement errors. Specifically to:
- Intrinsic stochastic error
- Binning of the measurement scale
- Random measurement noise
- Psychometric distortions
…
Peer reviewed Agent-based model to simulate equilibria and regime shifts emerged in lake ecosystems
no contributors listed | Published Tuesday, January 25, 2022(An empty output folder named “NETLOGOexperiment” in the same location with the LAKEOBS_MIX.nlogo file is required before the model can be run properly)
The model is motivated by regime shifts (i.e. abrupt and persistent transition) revealed in the previous paleoecological study of Taibai Lake. The aim of this model is to improve a general understanding of the mechanism of emergent nonlinear shifts in complex systems. Prelimnary calibration and validation is done against survey data in MLYB lakes. Dynamic population changes of function groups can be simulated and observed on the Netlogo interface.
Main functional groups in lake ecosystems were modelled as super-individuals in a space where they interact with each other. They are phytoplankton, zooplankton, submerged macrophyte, planktivorous fish, herbivorous fish and piscivorous fish. The relationships between these functional groups include predation (e.g. zooplankton-phytoplankton), competition (phytoplankton-macrophyte) and protection (macrophyte-zooplankton). Each individual has properties in size, mass, energy, and age as physiological variables and reproduce or die according to predefined criteria. A system dynamic model was integrated to simulate external drivers.
Set biological and environmental parameters using the green sliders first. If the data of simulation are to be logged, set “Logdata” as true and input the name of the file you want the spreadsheet(.csv) to be called. You will need create an empty folder called “NETLOGOexperiment” in the same level and location with the LAKEOBS_MIX.nlogo file. Press “setup” to initialise the system and “go” to start life cycles.
Universal Darwinism in Dutch Greenhouses
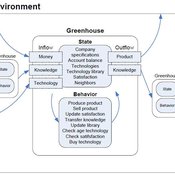
Julia Kasmire | Published Wednesday, May 09, 2012 | Last modified Saturday, April 27, 2013An ABM, derived from a case study and a series of surveys with greenhouse growers in the Westland, Netherlands. Experiments using this model showshow that the greenhouse horticulture industry displays diversity, adaptive complexity and an uneven distribution, which all suggest that the industry is an evolving system.
Development of coral reefs under climate change impacts and adaptation options
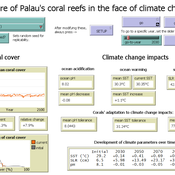
Nina Preußler | Published Friday, May 30, 2025This NetLogo model simulates how coral reefs around the islands of Palau would develop under different emission scenarios and with selected adaptation strategies. Reef health is indicated by coral cover (%) and is affected by four major climate change impacts: increasing sea surface temperature, sea level rise, ocean acidification, and more intense typhoons. The model differentiates between inner and outer reefs, with the former naturally adapted to warmer, more acidic waters. The simulation includes bleaching events and possible recovery. In addition, the user can choose between different coral transplantation strategies as well as regulate natural thermal adaptation rates.
Peer reviewed The Viability of the Social-Ecological Agroecosystem (ViSA) Spatial Agent-based Model
Mostafa Shaaban | Published Friday, June 03, 2022ViSA simulates the decision behaviors of different stakeholders showing demands for ecosystem services (ESS) in agricultural landscape. The lack of sufficient supply of ESSs triggers stakeholders to apply different management options to increase their supply. However, while attempting to reduce the supply-demand gap, conflicts arise among stakeholders due to the tradeoff nature of some ESS. ViSA investigates conditions and scenarios that can minimize such supply-demand gap while reducing the risk of conflicts by suggesting different mixes of management options and decision rules.
Displaying 10 of 349 results for "Miriam C. Kopels" clear search
