About the CoMSES Model Library more info
Our mission is to help computational modelers develop, document, and share their computational models in accordance with community standards and good open science and software engineering practices. Model authors can publish their model source code in the Computational Model Library with narrative documentation as well as metadata that supports open science and emerging norms that facilitate software citation, computational reproducibility / frictionless reuse, and interoperability. Model authors can also request private peer review of their computational models. Models that pass peer review receive a DOI once published.
All users of models published in the library must cite model authors when they use and benefit from their code.
Please check out our model publishing tutorial and feel free to contact us if you have any questions or concerns about publishing your model(s) in the Computational Model Library.
We also maintain a curated database of over 7500 publications of agent-based and individual based models with detailed metadata on availability of code and bibliometric information on the landscape of ABM/IBM publications that we welcome you to explore.
Displaying 10 of 1124 results for "Joan A Barcel%C3%B3" clear search
Stylized agricultural land-use model for resilience exploration
Patrick Bitterman | Published Tuesday, June 14, 2016 | Last modified Monday, April 08, 2019This model is a highly stylized land use model in the Clear Creek Watershed in Eastern Iowa, designed to illustrate the construction of stability landscapes within resilience theory.
Peer reviewed ABM to create populations with realistic Big Five Personality Trait Expressions
Michael Vogrin | Published Tuesday, May 30, 2023This model aims at creating agent populations that have “personalities”, as described by the Big Five Model of Personality. The expression of the Big Five in the agent population has the following properties, so that they resemble real life populations as closely as possible:
-The population mean of each trait is 0.5 on a scale from 0 to 1.
-The population-wide distribution of each trait approximates a normal distribution.
-The intercorrelations of the Big Five are close to those observed in the Literature.
The literature used to fit the model was a publication by Dimitri van der Linden, Jan te Nijenhuis, and Arnold B. Bakker:
…
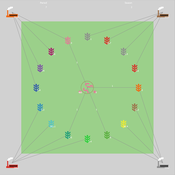
PSMED - Patagonia Simple Model of Ethnic Differentiation
Xavier Vilà Joan A Barceló J A Cuesta Florencia Del Castillo Ricardo Del Olmo José M Galán Laura Mameli Francisco J Miguel David Poza José I Santos | Published Tuesday, December 10, 2013Patagonia PSMED is an agent-based model designed to study a simple case of Evolution of Ethnic Differentiation. It replicates how can hunter-gatherer societies evolve and built cultural identities as a consequence of the way they interacted.
Peer reviewed Industrial Symbiosis Network implementation ABM
Igor Nikolic Kasper Pieter Hendrik Lange Gijsbert Korevaar Paulien Herder | Published Tuesday, December 01, 2020 | Last modified Wednesday, June 16, 2021The purpose of the model is to explore the influence of actor behaviour, combined with environment and business model design, on the survival rates of Industrial Symbiosis Networks (ISN), and the cash flows of the agents. We define an ISN to be robust, when it is able to run for 10 years, without falling apart due to leaving agents.
The model simulates the implementation of local waste exchange collaborations for compost production, through the ISN implementation stages of awareness, planning, negotiation, implementation, and evaluation.
One central firm plays the role of waste processor in a local composting initiative. This firm negotiates with other firms to become a supplier of their organic residual streams. The waste suppliers in the model can decide to join the initiative, or to have the waste brought to the external waste incinerator. The focal point of the model are the company-level interactions during the implementation or ending of synergies.
…
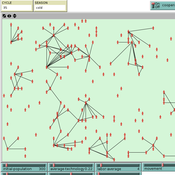
Peer reviewed TRANSOPE: a multi-agent model to simulate outsourcing networks in road freight transport.
Aitor Salas-Peña Blanca Rosa Cases Gutiérrez | Published Friday, October 21, 2022A road freight transport (RFT) operation involves the participation of several types of companies in its execution. The TRANSOPE model simulates the subcontracting process between 3 types of companies: Freight Forwarders (FF), Transport Companies (TC) and self-employed carriers (CA). These companies (agents) form transport outsourcing chains (TOCs) by making decisions based on supplier selection criteria and transaction acceptance criteria. Through their participation in TOCs, companies are able to learn and exchange information, so that knowledge becomes another important factor in new collaborations. The model can replicate multiple subcontracting situations at a local and regional geographic level.
The succession of n operations over d days provides two types of results: 1) Social Complex Networks, and 2) Spatial knowledge accumulation environments. The combination of these results is used to identify the emergence of new logistics clusters. The types of actors involved as well as the variables and parameters used have their justification in a survey of transport experts and in the existing literature on the subject.
As a result of a preferential selection process, the distribution of activity among agents shows to be highly uneven. The cumulative network resulting from the self-organisation of the system suggests a structure similar to scale-free networks (Albert & Barabási, 2001). In this sense, new agents join the network according to the needs of the market. Similarly, the network of preferential relationships persists over time. Here, knowledge transfer plays a key role in the assignment of central connector roles, whose participation in the outsourcing network is even more decisive in situations of scarcity of transport contracts.
Peter Diamond's Coconut Model (Heterogeneity and Learning)
Sven Banisch Eckehard Olbrich | Published Monday, May 30, 2016Agent-based version of the simple search and barter economy conceived by Peter Diamond in 1982. The model is also known as Coconut Model.
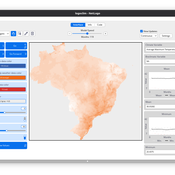
LogoClim: WorldClim in NetLogo
Daniel Vartanian Leandro Garcia Aline Martins de Carvalho Aline | Published Thursday, July 03, 2025 | Last modified Tuesday, September 16, 2025LogoClim is a NetLogo model for simulating and visualizing global climate conditions. It allows researchers to integrate high-resolution climate data into agent-based models, supporting reproducible research in ecology, agriculture, environmental sciences, and other fields that rely on climate data.
The model utilizes raster data to represent climate variables such as temperature and precipitation over time. It incorporates historical data (1951-2024) and future climate projections (2021-2100) derived from global climate models under various Shared Socioeconomic Pathways (SSPs, O’Neill et al., 2017). All climate inputs come from WorldClim 2.1, a widely used source of high-resolution, interpolated climate datasets based on weather station observations worldwide (Fick & Hijmans, 2017).
LogoClim follows the FAIR Principles for Research Software (Barker et al., 2022) and is openly available on the CoMSES Network and GitHub. See the Logônia model for an example of its integration into a full NetLogo simulation.
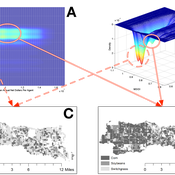
Critical Sustainability Transitions: Relaunching local agriculture after decline (Model code and description)
Pedro Lopez-Merino | Published Tuesday, April 30, 2024This model simulates the dynamics of agricultural land use change, specifically the transition between agricultural and non-agricultural land use in a spatial context. It explores the influence of various factors such as agricultural profitability, path dependency, and neighborhood effects on land use decisions.
The model operates on a grid of patches representing land parcels. Each patch can be in one of two states: exploited (green, representing agricultural land) or unexploited (brown, representing non-agricultural land). Agents (patches) transition between these states based on probabilistic rules. The main factors affecting these transitions are agricultural profitability, path dependency, and neighborhood effects.
-Agricultural Profitability: This factor is determined by the prob-agri function, which calculates the probability of a non-agricultural patch converting to agricultural based on income differences between agriculture and other sectors. -Path Dependency: Represented by the path-dependency parameter, it influences the likelihood of patches changing their state based on their current state. It’s a measure of inertia or resistance to change. -Neighborhood Effects: The neighborhood function calculates the number of exploited (agricultural) neighbors of a patch. This influences the decision of a patch to convert to agricultural land, representing the influence of surrounding land use on the decision-making process.
How does knowledge infrastructure mobilization influence the safe operating space of regulated exploited ecosystems?
Jean-Denis Mathias | Published Tuesday, July 17, 2018Decision-makers often have to act before critical times to avoid the collapse of ecosystems using knowledge \textcolor{red}{that can be incomplete or biased}. Adaptive management may help managers tackle such issues. However, because the knowledge infrastructure required for adaptive management may be mobilized in several ways, we study the quality and the quantity of knowledge provided by this knowledge infrastructure. In order to analyze the influence of mobilized knowledge, we study how the following typology of knowledge and its use may impact the safe operating space of exploited ecosystems: 1) knowledge of the past based on a time series distorted by measurement errors; 2) knowledge of the current systems’ dynamics based on the representativeness of the decision-makers’ mental models of the exploited ecosystem; 3) knowledge of future events based on decision-makers’ likelihood estimates of extreme events based on modeling infrastructure (models and experts to interpret them) they have at their disposal. We consider different adaptive management strategies of a general regulated exploited ecosystem model and we characterize the robustness of these strategies to biased knowledge. Our results show that even with significant mobilized knowledge and optimal strategies, imperfect knowledge may still shrink the safe operating space of the system leading to the collapse of the system. However, and perhaps more interestingly, we also show that in some cases imperfect knowledge may unexpectedly increase the safe operating space by suggesting cautious strategies.
The code enables to calculate the safe operating spaces of different managers in the case of biased and unbiased knowledge.
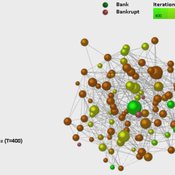
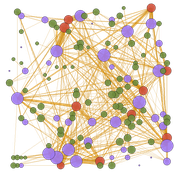
Dynamic Interbank Network Simulator
Valentina Guleva | Published Wednesday, November 23, 2016 | Last modified Monday, April 13, 2020The model provides instruments for the simulation of interbank network evolution. There are tools for dynamic network analysis, allowing to evaluate graph topological invariants, thermodynamic network features and combinational node-based features.
Displaying 10 of 1124 results for "Joan A Barcel%C3%B3" clear search