About the CoMSES Model Library more info
Our mission is to help computational modelers develop, document, and share their computational models in accordance with community standards and good open science and software engineering practices. Model authors can publish their model source code in the Computational Model Library with narrative documentation as well as metadata that supports open science and emerging norms that facilitate software citation, computational reproducibility / frictionless reuse, and interoperability. Model authors can also request private peer review of their computational models. Models that pass peer review receive a DOI once published.
All users of models published in the library must cite model authors when they use and benefit from their code.
Please check out our model publishing tutorial and feel free to contact us if you have any questions or concerns about publishing your model(s) in the Computational Model Library.
We also maintain a curated database of over 7500 publications of agent-based and individual based models with detailed metadata on availability of code and bibliometric information on the landscape of ABM/IBM publications that we welcome you to explore.
Displaying 10 of 13 results visualization clear search
LogoClim: WorldClim in NetLogo
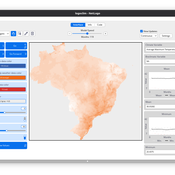
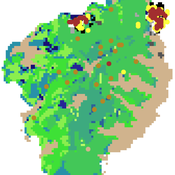
Daniel Vartanian Leandro Garcia Aline Martins de Carvalho Aline | Published Thursday, July 03, 2025 | Last modified Tuesday, September 16, 2025LogoClim is a NetLogo model for simulating and visualizing global climate conditions. It allows researchers to integrate high-resolution climate data into agent-based models, supporting reproducible research in ecology, agriculture, environmental sciences, and other fields that rely on climate data.
The model utilizes raster data to represent climate variables such as temperature and precipitation over time. It incorporates historical data (1951-2024) and future climate projections (2021-2100) derived from global climate models under various Shared Socioeconomic Pathways (SSPs, O’Neill et al., 2017). All climate inputs come from WorldClim 2.1, a widely used source of high-resolution, interpolated climate datasets based on weather station observations worldwide (Fick & Hijmans, 2017).
LogoClim follows the FAIR Principles for Research Software (Barker et al., 2022) and is openly available on the CoMSES Network and GitHub. See the Logônia model for an example of its integration into a full NetLogo simulation.
Status hierarchies and the emergence of cooperation in task groups
Hsuan-Wei Lee | Published Thursday, January 02, 2025This repository contains an agent-based simulation model exploring how status hierarchies influence the emergence and sustainability of cooperation in task-oriented groups. The model builds on evolutionary game theory to examine the dynamics of cooperation under single-leader and multi-leader hierarchies, investigating factors such as group size, assortativity, and hierarchical clarity. Key findings highlight the trade-offs between different leadership structures in fostering group cooperation and reveal the conditions under which cooperation is most stable.
The repository includes code for simulations, numerical analysis scripts, and visualization tools to replicate the results presented in the manuscript titled “Status hierarchies and the emergence of cooperation in task groups.”
Feel free to explore, reproduce the findings, or adapt the model for further research!
Seascapes of the Unreal: Using Agent Based Modeling to Examine Traditional Coast Salish Maritime Mobility
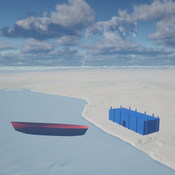
Adam Rorabaugh | Published Friday, December 22, 2023Non-traditional tools and mediums can provide unique methodological and interpretive opportunities for archaeologists. In this case, the Unreal Engine (UE), which is typically used for games and media, has provided a powerful tool for non-programmers to engage with 3D visualization and programming as never before. UE has a low cost of entry for researchers as it is free to download and has user-friendly “blueprint” tools that are visual and easily extendable. Traditional maritime mobility in the Salish Sea is examined using an agent-based model developed in blueprints. Focusing on the sea canoe travel of the Straits Salish northwestern Washington State and southwest British Columbia. This simulation integrates GIS data to assess travel time between Coast Salish archaeological village locations and archaeologically represented resource gathering areas. Transportation speeds informed by ethnographic data were used to examine travel times for short forays and longer inter-village journeys. The results found that short forays tended to half day to full day trips when accounting for resource gathering activities. Similarly, many locations in the Salish Sea were accessible in long journeys within two to three days, assuming fair travel conditions. While overall transportation costs to reach sites may be low, models such as these highlight the variability in transport risk and cost. The integration of these types of tools, traditionally used for entertainment, can increase the accessibility of modeling approaches to researchers, be expanded to digital storytelling, including aiding in the teaching of traditional ecological knowledge and placenames, and can have wide applications beyond maritime archaeology.
This is v0.01 of a UE5.2.1 agent based model.
Models associated with paper entitled "Polarization in Social Media: A Virtual Worlds-Based Approach"
Sven Banisch Dennis Jacob | Published Thursday, June 22, 2023This model contains MATLAB code describing the virtual worlds framework used in the paper entitled “Polarization in Social Media: A Virtual Worlds-Based Approach.” The parent directory contains driver code for replicating results from the paper. Additionally, the source code is structured by three directories:
- Data Structures: Contains classes and objects used in the code, such as the virtualWorlds.m
- Metrics: Contains code which computes metrics, such as congruentLinks.m
- Visualization: Contains code for generating pictures and plots, such as drawSystemState.m
…
An integrated socio-economic Agent-Based Modeling framework towards assessing farmers’ decision making under water scarcity and varying utility function
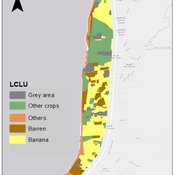
Ghinwa Harik | Published Tuesday, September 13, 2022 | Last modified Wednesday, November 23, 2022A spatio-temporal Agent Based Modeling (ABM) framework is developed to probabilistically predict farmers’ decisions in the context of climate-induced water scarcity under varying utility optimization functions. The proposed framework forecasts farmers’ behavior assuming varying utility functions. The framework allows decision makers to forecast the behavior of farmers through a user-friendly platform with clear output visualization. The functionality of the proposed ABM is illustrated in an agriculturally dominated plain along the Eastern Mediterranean coastline.
Study area GIS data available upon request to [email protected]
Model of communication between two groups of managers in the course of project implementation
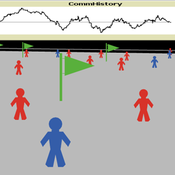
Smarzhevskiy Ivan | Published Monday, December 07, 2020This is a simulation model of communication between two groups of managers in the course of project implementation. The “world” of the model is a space of interaction between project participants, each of which belongs either to a group of work performers or to a group of customers. Information about the progress of the project is publicly available and represents the deviation Earned value (EV) from the planned project value (cost baseline).
The key elements of the model are 1) persons belonging to a group of customers or performers, 2) agents that are communication acts. The life cycle of persons is equal to the time of the simulation experiment, the life cycle of the communication act is 3 periods of model time (for the convenience of visualizing behavior during the experiment). The communication act occurs at a specific point in the model space, the coordinates of which are realized as random variables. During the experiment, persons randomly move in the model space. The communication act involves persons belonging to a group of customers and a group of performers, remote from the place of the communication act at a distance not exceeding the value of the communication radius (MaxCommRadius), while at least one representative from each of the groups must participate in the communication act. If none are found, the communication act is not carried out. The number of potential communication acts per unit of model time is a parameter of the model (CommPerTick).
The managerial sense of the feedback is the stimulating effect of the positive value of the accumulated communication complexity (positive background of the project implementation) on the productivity of the performers. Provided there is favorable communication (“trust”, “mutual understanding”) between the customer and the contractor, it is more likely that project operations will be performed with less lag behind the plan or ahead of it.
The behavior of agents in the world of the model (change of coordinates, visualization of agents’ belonging to a specific communicative act at a given time, etc.) is not informative. Content data are obtained in the form of time series of accumulated communicative complexity, the deviation of the earned value from the planned value, average indicators characterizing communication - the total number of communicative acts and the average number of their participants, etc. These data are displayed on graphs during the simulation experiment.
The control elements of the model allow seven independent values to be varied, which, even with a minimum number of varied values (three: minimum, maximum, optimum), gives 3^7 = 2187 different variants of initial conditions. In this case, the statistical processing of the results requires repeated calculation of the model indicators for each grid node. Thus, the set of varied parameters and the range of their variation is determined by the logic of a particular study and represents a significant narrowing of the full set of initial conditions for which the model allows simulation experiments.
…
FNNR-ABM
Judy Mak | Published Thursday, February 28, 2019 | Last modified Saturday, December 07, 2019FNNR-ABM is an agent-based model that simulates human activity, Guizhou snub-nosed monkey movement, and GTGP-enrolled land parcel conversion in the Fanjingshan National Nature Reserve in Guizhou, China.
Quick-start guide:
1. Install Python and set environmental path variables.
2. Install the mesa, matplotlib (optional), and pyshp (optional) Python libraries.
3. Configure fnnr_config_file.py.
…
Peer reviewed ELTAP-Egy model (Energy Landscape Transition Analysis and Planning in Egypt)
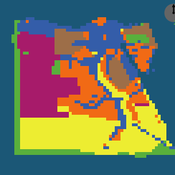
Mostafa Shaaban Jürgen Scheffran Jürgen Böhner Mohamed Salah Elsobki | Published Saturday, December 29, 2018The model investigates conditions, scenarios and strategies for future planning of energy in Egypt, with an emphasis on alternative energy pathways and a sustainable electricity supply mix as part of an energy roadmap till the year 2100. It combines the multi-criteria decision analysis (MCDA) with agent-based modeling (ABM) and Geographic Information Systems (GIS) visualization to integrate the interactions of the decisions of multi-agents, the multi-criteria evaluation of sustainability, the time factor and the site factors to assess the transformation of energy landscapes.
A Simulation of Entrepreneurial Spawning
Mark Bagley | Published Wednesday, June 08, 2016 | Last modified Friday, June 30, 2017Industrial clustering patterns are the result of an entrepreneurial process where spinoffs inherit the ideas and attributes of their parent firms. This computational model maps these patterns using abstract methodologies.
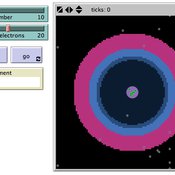
Due to teacher requests to represent changes in atomic radius, we developed a visualization of the first 36 elements in Netlogo
Displaying 10 of 13 results visualization clear search
