About the CoMSES Model Library more info
Our mission is to help computational modelers develop, document, and share their computational models in accordance with community standards and good open science and software engineering practices. Model authors can publish their model source code in the Computational Model Library with narrative documentation as well as metadata that supports open science and emerging norms that facilitate software citation, computational reproducibility / frictionless reuse, and interoperability. Model authors can also request private peer review of their computational models. Models that pass peer review receive a DOI once published.
All users of models published in the library must cite model authors when they use and benefit from their code.
Please check out our model publishing tutorial and feel free to contact us if you have any questions or concerns about publishing your model(s) in the Computational Model Library.
We also maintain a curated database of over 7500 publications of agent-based and individual based models with detailed metadata on availability of code and bibliometric information on the landscape of ABM/IBM publications that we welcome you to explore.
Displaying 10 of 57 results income clear search
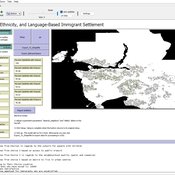
Geospatial Agent-Based Model of Immigrant Settlement Dynamics in Metro Vancouver
Liliana Perez Navid Mahdizadeh Gharakhanlou Maryam Yousefi | Published Wednesday, December 03, 2025This agent-based model simulates how new immigrant households choose where to live in Metro Vancouver under the origins diversity scenario. The model begins with 16,000 household agents, reflecting an expected annual population increase of about 42,500 people based on an average household size of 2.56. Each agent is assigned four characteristics: one of ten origin categories, income level (adjusted using NOC data and recent immigrant earnings), likelihood of having children, and preferred mode of commuting. The ten origin groups are drawn from Census patterns, including six subgroups within the broader Asian category (China, India, the Philippines, Iran, South Korea, and Other Asian countries) and two categories for immigrants from the Americas. This refined classification better captures the diversity of newcomers arriving in the region.
Peer reviewed Urban Transport Mode Choices
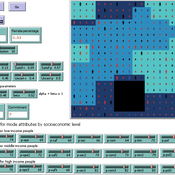
Kathleen Salazar -Serna Lorena Cadavid Carlos Franco | Published Thursday, May 22, 2025The model represents urban commuters’ transport mode choices among cars, public transit, and motorcycles—a mode highly prevalent in developing countries. Using an agent-based modeling approach, it simulates transport dynamics and serves as a testbed for evaluating policies aimed at improving mobility.
The model simulates an ecosystem of human agents who decide, at each time step, which mode of transportation to use for commuting to work. Their decision is based on a combination of personal satisfaction with their most recent journey—evaluated across a vector of individual needs—the information they crowdsource from their social network, and their personal uncertainty regarding trying new transport options.
Agents are assigned demographic attributes such as sex, age, and income level, and are distributed across city neighborhoods according to their socioeconomic status. To represent social influence in decision-making, agents are connected via a scale-free social network topology, where connections are more likely among agents within the same socioeconomic group, reflecting the tendency of individuals to form social ties with similar others.
…
Finance and Market Concentration Using Agent-Based Modeling: Evidence from South Korea
Yunkyeong Seo Zeynep Elif Altiner Sumin Lee Ilchul Moon Taesub Yun | Published Friday, March 28, 2025Amidst the global trend of increasing market concentration, this paper examines the role of finance
in shaping it. Using Agent-Based Modeling (ABM), we analyze the impact of financial policies on market concentration
and its closely related variables: economic growth and labor income share. We extend the Keynes
meets Schumpeter (K+S) model by incorporating two critical assumptions that influence market concentration.
Policy experiments are conducted with a model validated against historical trends in South Korea. For policy
variables, the Debt-to-Sales Ratio (DSR) limit and interest rate are used as levers to regulate the quantity and
…
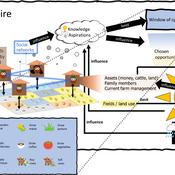
3spire: an agent-based model for exploring aspiration adaptation theory and its implications on smallholder farmers in Ethiopia
ateeuw Yue Dou Markus A Meyer Andrew Nelson | Published Sunday, February 16, 20253spire is an ABM where farming households make management decisions aimed at satisficing along the aspirational dimensions: food self-sufficiency, income, and leisure. Households decision outcomes depend on their social networks, knowledge, assets, household needs, past management, and climate/market trends
Gini Palma microsimulation
Edgar Oliveira | Published Wednesday, December 11, 2024The model is a microsimulation, where the agents don’t Interact with each other. It simulates income distribution, unemployment dynamics, education, and Family grant in Brazil, focusing on the impact on social inequality. It tracks the indicators Gini index, Lorenz curve, and Palma ratio. The objective is to explore how these factors influence wealth distribution and social inequality over time.
This work was developed in partnership with the Graduate Program in Computational Modeling, in the Universidade Federal do Rio Grande - FURG, in Brazil.
The effects of complementary microfinance service on income and lifting poor out of poverty: An agent-based modeling study
Mohammad Reza Sadeghi Moghaddam Mehrdad Hamidi Hedayat | Published Thursday, June 27, 2024This model simulate the process of borrowing from an Microfinance Institute (MFI) and starting a business within a poor household.
Critical Sustainability Transitions: Relaunching local agriculture after decline (Model code and description)
Pedro Lopez-Merino | Published Tuesday, April 30, 2024This model simulates the dynamics of agricultural land use change, specifically the transition between agricultural and non-agricultural land use in a spatial context. It explores the influence of various factors such as agricultural profitability, path dependency, and neighborhood effects on land use decisions.
The model operates on a grid of patches representing land parcels. Each patch can be in one of two states: exploited (green, representing agricultural land) or unexploited (brown, representing non-agricultural land). Agents (patches) transition between these states based on probabilistic rules. The main factors affecting these transitions are agricultural profitability, path dependency, and neighborhood effects.
-Agricultural Profitability: This factor is determined by the prob-agri function, which calculates the probability of a non-agricultural patch converting to agricultural based on income differences between agriculture and other sectors. -Path Dependency: Represented by the path-dependency parameter, it influences the likelihood of patches changing their state based on their current state. It’s a measure of inertia or resistance to change. -Neighborhood Effects: The neighborhood function calculates the number of exploited (agricultural) neighbors of a patch. This influences the decision of a patch to convert to agricultural land, representing the influence of surrounding land use on the decision-making process.
AgriAdopt
Sebastian Rasch | Published Tuesday, March 26, 2024The purpose of this model is to project the dynamics of technology adoption of autonomous weeding robots by sugar beet producing farmers in North Rhine-Westphalia (NRW). Moreover, the design of the model serves the purpose to investigate second-order effects of robot adoption on shifts in farm income and on production quantities of main crops produced in North Rhine-Westphalia. One aim is to analyse the impact of technology attributes and costs of pesticides on adoption patterns.
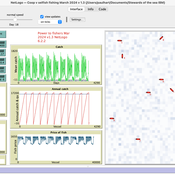
Peer reviewed An IBM of a fishing fleet exploiting a pelagic resource and with a fisher management system. A preliminary version.
Paul Hart | Published Tuesday, March 19, 2024A fisher directed management system was describeded by Hart (2021). It was proposed that fishers should only be allowed to exploit a resource if they collaborated in a resource management system for which they would own and be collectively responsible for. As part of the system fishers would need to follow the rules of exploitation set by the group and provide a central unit with data with which to monitor the fishery. Any fisher not following the rules would at first be fined but eventually expelled from the fishery if he/she continued to act selfishly. This version of the model establishes the dynamics of a fleet of vessels and controls overfishing by imposing fines on fishers whose income is low and who are tempted to keep fishing beyond the set quota which is established each year depending on the abundance of the fish stock. This version will later be elaborated to have interactions between the fishers including pressure to comply with the norms set by the group and which could lead to a stable management system.
Agent-based tax evasion model for investigating impacts of public disclosure
Hiroyuki Sano | Published Thursday, March 14, 2024The model explores the impact of public disclosure on tax compliance among diverse agents, including individual taxpayers and a tax authority. It incorporates heterogeneous preferences and income endowments among taxpayers, captured through a utility function that considers psychic costs subtracted from expected pecuniary utility. These costs include moral, reciprocity, and stigma costs associated with norm violations, leading to variations in taxpayers’ risk attitudes and related parameters. The tax authority’s attributes, such as the frequency of random audits, penalty rate, and the choice between partial or full disclosure, remain fixed throughout the simulation. Income endowments and preference parameters are randomly assigned to taxpayers at the outset.
Taxpayers maximize their expected utility by reporting income, taking into account tax, penalty, and audit rates. They make annual decisions based on their own and their peers’ behaviors from the previous year. Taxpayers indirectly interact at the societal level through public disclosure conducted by the tax authority, exchanging tax information among peers. Each period in the simulation collects data on total reported income, average compliance rates per income group, distribution of compliance rates, counts of compliers, full evaders, partial evaders, and the numbers of taxpayers experiencing guilt and anger. The model evaluates whether public disclosure positively or negatively impacts compliance rates and quantifies this impact based on aggregated individual reporting behaviors.
Displaying 10 of 57 results income clear search


