Our mission is to help computational modelers develop, document, and share their computational models in accordance with community standards and good open science and software engineering practices. Model authors can publish their model source code in the Computational Model Library with narrative documentation as well as metadata that supports open science and emerging norms that facilitate software citation, computational reproducibility / frictionless reuse, and interoperability. Model authors can also request private peer review of their computational models. Models that pass peer review receive a DOI once published.
All users of models published in the library must cite model authors when they use and benefit from their code.
Please check out our model publishing tutorial and feel free to contact us if you have any questions or concerns about publishing your model(s) in the Computational Model Library.
Displaying 10 of 186 results for "Alan J Mckane" clear search
Enhancing recycling of construction materials; an agent based model with empirically based decision parameters
Igor Nikolic Claudia Binder Christof Knoeri Hans-Joerg Althaus | Published Sunday, October 21, 2012 | Last modified Monday, June 09, 2014This model allows for analyzing the most efficient levers for enhancing the use of recycled construction materials, and the role of empirically based decision parameters.
PSMED - Patagonia Simple Model of Ethnic Differentiation
Xavier Vilà Joan A Barceló J A Cuesta Florencia Del Castillo Ricardo Del Olmo José M Galán Laura Mameli Francisco J Miguel David Poza José I Santos | Published Tuesday, December 10, 2013Patagonia PSMED is an agent-based model designed to study a simple case of Evolution of Ethnic Differentiation. It replicates how can hunter-gatherer societies evolve and built cultural identities as a consequence of the way they interacted.
WeDiG Sim
Reza Shamsaee | Published Monday, May 14, 2012 | Last modified Saturday, April 27, 2013WeDiG Sim- Weighted Directed Graph Simulator - is an open source application that serves to simulate complex systems. WeDiG Sim reflects the behaviors of those complex systems that put stress on scale-free, weightedness, and directedness. It has been implemented based on “WeDiG model” that is newly presented in this domain. The WeDiG model can be seen as a generalized version of “Barabási-Albert (BA) model”. WeDiG not only deals with weighed directed systems, but also it can handle the […]
Peer reviewed Price Evolution with Expectations
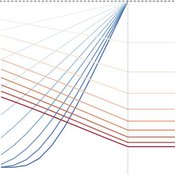
J M Applegate Gesine Steudel Armin Haas Carlo Jaeger | Published Friday, September 10, 2021The Price Evolution with Expectations model provides the opportunity to explore the question of non-equilibrium market dynamics, and how and under which conditions an economic system converges to the classically defined economic equilibrium. To accomplish this, we bring together two points of view of the economy; the classical perspective of general equilibrium theory and an evolutionary perspective, in which the current development of the economic system determines the possibilities for further evolution.
The Price Evolution with Expectations model consists of a representative firm producing no profit but producing a single good, which we call sugar, and a representative household which provides labour to the firm and purchases sugar.The model explores the evolutionary dynamics whereby the firm does not initially know the household demand but eventually this demand and thus the correct price for sugar given the household’s optimal labour.
The model can be run in one of two ways; the first does not include money and the second uses money such that the firm and/or the household have an endowment that can be spent or saved. In either case, the household has preferences for leisure and consumption and a demand function relating sugar and price, and the firm has a production function and learns the household demand over a set number of time steps using either an endogenous or exogenous learning algorithm. The resulting equilibria, or fixed points of the system, may or may not match the classical economic equilibrium.
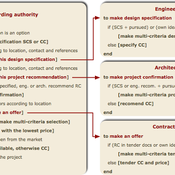
Model of communication between two groups of managers in the course of project implementation
Smarzhevskiy Ivan | Published Monday, December 07, 2020This is a simulation model of communication between two groups of managers in the course of project implementation. The “world” of the model is a space of interaction between project participants, each of which belongs either to a group of work performers or to a group of customers. Information about the progress of the project is publicly available and represents the deviation Earned value (EV) from the planned project value (cost baseline).
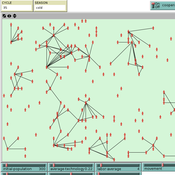
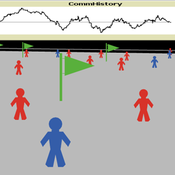
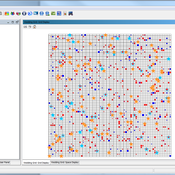
The key elements of the model are 1) persons belonging to a group of customers or performers, 2) agents that are communication acts. The life cycle of persons is equal to the time of the simulation experiment, the life cycle of the communication act is 3 periods of model time (for the convenience of visualizing behavior during the experiment). The communication act occurs at a specific point in the model space, the coordinates of which are realized as random variables. During the experiment, persons randomly move in the model space. The communication act involves persons belonging to a group of customers and a group of performers, remote from the place of the communication act at a distance not exceeding the value of the communication radius (MaxCommRadius), while at least one representative from each of the groups must participate in the communication act. If none are found, the communication act is not carried out. The number of potential communication acts per unit of model time is a parameter of the model (CommPerTick).
The managerial sense of the feedback is the stimulating effect of the positive value of the accumulated communication complexity (positive background of the project implementation) on the productivity of the performers. Provided there is favorable communication (“trust”, “mutual understanding”) between the customer and the contractor, it is more likely that project operations will be performed with less lag behind the plan or ahead of it.
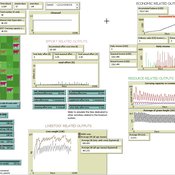
The behavior of agents in the world of the model (change of coordinates, visualization of agents’ belonging to a specific communicative act at a given time, etc.) is not informative. Content data are obtained in the form of time series of accumulated communicative complexity, the deviation of the earned value from the planned value, average indicators characterizing communication - the total number of communicative acts and the average number of their participants, etc. These data are displayed on graphs during the simulation experiment.
The control elements of the model allow seven independent values to be varied, which, even with a minimum number of varied values (three: minimum, maximum, optimum), gives 3^7 = 2187 different variants of initial conditions. In this case, the statistical processing of the results requires repeated calculation of the model indicators for each grid node. Thus, the set of varied parameters and the range of their variation is determined by the logic of a particular study and represents a significant narrowing of the full set of initial conditions for which the model allows simulation experiments.
…
Knowledge Based Economy
Guido Fioretti Sirio Capizzi Ruggero Rossi Martina Casari Ala Jlif | Published Tuesday, May 18, 2021Knowledge Based Economy (KBE) is an artificial economy where firms placed in geographical space develop original knowledge, imitate one another and eventually recombine pieces of knowledge. In KBE, consumer value arises from the capability of certain pieces of knowledge to bridge between existing items (e.g., Steve Jobs illustrated the first smartphone explaining that you could make a call with it, but also listen to music and navigate the Internet). Since KBE includes a mechanism for the generation of value, it works without utility functions and does not need to model market exchanges.
Peer reviewed soslivestock model
Marco Janssen Irene Perez Ibarra Diego J. Soler-Navarro Alicia Tenza Peral | Published Wednesday, May 28, 2025 | Last modified Tuesday, June 10, 2025The purpose of this model is to analyze how different management strategies affect the wellbeing, sustainability and resilience of an extensive livestock system under scenarios of climate change and landscape configurations. For this purpose, it simulates one cattle farming system, in which agents (cattle) move through the space using resources (grass). Three farmer profiles are considered: 1) a subsistence farmer that emphasizes self-sufficiency and low costs with limited attention to herd management practices, 2) a commercial farmer focused on profit maximization through efficient production methods, and 3) an environmental farmer that prioritizes conservation of natural resources and animal welfare over profit maximization. These three farmer profiles share the same management strategies to adapt to climate and resource conditions, but differ in their goals and decision-making criteria for when, how, and whether to implement those strategies. This model is based on the SequiaBasalto model (Dieguez Cameroni et al. 2012, 2014, Bommel et al. 2014 and Morales et al. 2015), replicated in NetLogo by Soler-Navarro et al. (2023).
One year is 368 days. Seasons change every 92 days. Each step begins with the growth of grass as a function of climate and season. This is followed by updating the live weight of animals according to the grass height of their patch, and grass consumption, which is determined based on the updated live weight. Animals can be supplemented by the farmer in case of severe drought. After consumption, cows grow and reproduce, and a new grass height is calculated. This updated grass height value becomes the starting grass height for the next day. Cows then move to the next area with the highest grass height. After that, cattle prices are updated and cattle sales are held on the first day of fall. In the event of a severe drought, special sales are held. Finally, at the end of the day, the farm balance and the farmer’s effort are calculated.
MERCURY extension: population
Tom Brughmans | Published Thursday, May 23, 2019This model is an extended version of the original MERCURY model (https://www.comses.net/codebases/4347/releases/1.1.0/ ) . It allows for experiments to be performed in which empirically informed population sizes of sites are included, that allow for the scaling of the number of tableware traders with the population of settlements, and for hypothesised production centres of four tablewares to be used in experiments.
Experiments performed with this population extension and substantive interpretations derived from them are published in:
Hanson, J.W. & T. Brughmans. In press. Settlement scale and economic networks in the Roman Empire, in T. Brughmans & A.I. Wilson (ed.) Simulating Roman Economies. Theories, Methods and Computational Models. Oxford: Oxford University Press.
…
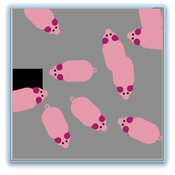
Tail biting behaviour in pigs
Iris J.M.M. Boumans Iris Jmm Boumans | Published Friday, April 22, 2016 | Last modified Wednesday, September 14, 2016The model simulates tail biting behaviour in pigs and how they can turn into a biter and/or victim. The effect of a redirected motivation, behavioural changes in victims and preference to bite a lying pig on tail biting can be tested in the model
Wedding Doughnut
Eric Silverman Jason Hilton Jakub Bijak Viet Cao | Published Thursday, December 20, 2012 | Last modified Friday, September 20, 2013A reimplementation of the Wedding Ring model by Francesco Billari. We investigate partnership formation in an agent-based framework, and combine this with statistical demographic projections using real empirical data.
Displaying 10 of 186 results for "Alan J Mckane" clear search