About the CoMSES Model Library more info
Our mission is to help computational modelers develop, document, and share their computational models in accordance with community standards and good open science and software engineering practices. Model authors can publish their model source code in the Computational Model Library with narrative documentation as well as metadata that supports open science and emerging norms that facilitate software citation, computational reproducibility / frictionless reuse, and interoperability. Model authors can also request private peer review of their computational models. Models that pass peer review receive a DOI once published.
All users of models published in the library must cite model authors when they use and benefit from their code.
Please check out our model publishing tutorial and feel free to contact us if you have any questions or concerns about publishing your model(s) in the Computational Model Library.
We also maintain a curated database of over 7500 publications of agent-based and individual based models with detailed metadata on availability of code and bibliometric information on the landscape of ABM/IBM publications that we welcome you to explore.
Displaying 10 of 272 results for "Alexis Comber" clear search
Sensitivity of a population submitted to floods to unknown upcoming floods and parameters of the dynamics
Sylvie Huet | Published Wednesday, September 22, 2021This work is a java implementation of a study of the viability of a population submitted to floods. The population derives some benefit from living in a certain environment. However, in this environment, floods can occur and cause damage. An individual protection measure can be adopted by those who wish and have the means to do so. The protection measure reduces the damage in case of a flood. However, the effectiveness of this measure deteriorates over time. Individual motivation to adopt this measure is boosted by the occurrence of a flood. Moreover, the public authorities can encourage the population to adopt this measure by carrying out information campaigns, but this comes at a cost. People’s decisions are modelled based on the Protection Motivation Theory (Rogers1975, Rogers 1997, Maddux1983) arguing that the motivation to protect themselves depends on their perception of risk, their capacity to cope with risk and their socio-demographic characteristics.
While the control designing proper informations campaigns to remain viable every time is computed in the work presented in https://www.comses.net/codebases/e5c17b1f-0121-4461-9ae2-919b6fe27cc4/releases/1.0.0/, the aim of the present work is to produce maps of probable viability in case the serie of upcoming floods is unknown as well as much of the parameters for the population dynamics. These maps are bi-dimensional, based on the value of known parameters: the current average wealth of the population and their actual or possible future annual revenues.
Peer reviewed BAM: The Bottom-up Adaptive Macroeconomics Model
Alejandro Platas López Alejandro Guerra-Hernández | Published Tuesday, January 14, 2020 | Last modified Sunday, July 26, 2020Overview
Purpose
Modeling an economy with stable macro signals, that works as a benchmark for studying the effects of the agent activities, e.g. extortion, at the service of the elaboration of public policies..
…
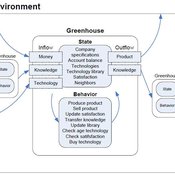
Universal Darwinism in Dutch Greenhouses
Julia Kasmire | Published Wednesday, May 09, 2012 | Last modified Saturday, April 27, 2013An ABM, derived from a case study and a series of surveys with greenhouse growers in the Westland, Netherlands. Experiments using this model showshow that the greenhouse horticulture industry displays diversity, adaptive complexity and an uneven distribution, which all suggest that the industry is an evolving system.
Ant Colony Optimization for infrastructure routing
Igor Nikolic Emile Chappin P W Heijnen | Published Wednesday, March 05, 2014 | Last modified Saturday, March 24, 2018The mode implements a variant of Ant Colony Optimization to explore routing on infrastructures through a landscape with forbidden zones, connecting multiple sinks to one source.
Talent vs Luck: the role of randomness in success and failure
Alessandro Pluchino Alessio Emanuele Biondo Andrea Rapisarda | Published Monday, July 16, 2018The largely dominant meritocratic paradigm of highly competitive Western cultures is rooted on the belief that success is due mainly, if not exclusively, to personal qualities such as talent, intelligence, skills, smartness, efforts, willfulness, hard work or risk taking. Sometimes, we are willing to admit that a certain degree of luck could also play a role in achieving significant material success. But, as a matter of fact, it is rather common to underestimate the importance of external forces in individual successful stories. It is very well known that intelligence (or, more in general, talent and personal qualities) exhibits a Gaussian distribution among the population, whereas the distribution of wealth - often considered a proxy of success - follows typically a power law (Pareto law), with a large majority of poor people and a very small number of billionaires. Such a discrepancy between a Normal distribution of inputs, with a typical scale (the average talent or intelligence), and the scale invariant distribution of outputs, suggests that some hidden ingredient is at work behind the scenes. In a recent paper, with the help of this very simple agent-based model realized with NetLogo, we suggest that such an ingredient is just randomness. In particular, we show that, if it is true that some degree of talent is necessary to be successful in life, almost never the most talented people reach the highest peaks of success, being overtaken by mediocre but sensibly luckier individuals. As to our knowledge, this counterintuitive result - although implicitly suggested between the lines in a vast literature - is quantified here for the first time. It sheds new light on the effectiveness of assessing merit on the basis of the reached level of success and underlines the risks of distributing excessive honors or resources to people who, at the end of the day, could have been simply luckier than others. With the help of this model, several policy hypotheses are also addressed and compared to show the most efficient strategies for public funding of research in order to improve meritocracy, diversity and innovation.

06b EiLab_Model_I_V5.00 NL
Garvin Boyle | Published Saturday, October 05, 2019EiLab - Model I - is a capital exchange model. That is a type of economic model used to study the dynamics of modern money which, strangely, is very similar to the dynamics of energetic systems. It is a variation on the BDY models first described in the paper by Dragulescu and Yakovenko, published in 2000, entitled “Statistical Mechanics of Money”. This model demonstrates the ability of capital exchange models to produce a distribution of wealth that does not have a preponderance of poor agents and a small number of exceedingly wealthy agents.
This is a re-implementation of a model first built in the C++ application called Entropic Index Laboratory, or EiLab. The first eight models in that application were labeled A through H, and are the BDY models. The BDY models all have a single constraint - a limit on how poor agents can be. That is to say that the wealth distribution is bounded on the left. This ninth model is a variation on the BDY models that has an added constraint that limits how wealthy an agent can be? It is bounded on both the left and right.
EiLab demonstrates the inevitable role of entropy in such capital exchange models, and can be used to examine the connections between changing entropy and changes in wealth distributions at a very minute level.
…
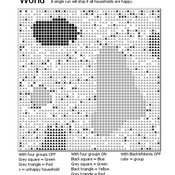
Introducing two extensions of Schelling's segregation model
Andreas Flache Carlos A. de Matos Fernandes | Published Monday, January 25, 2021Schelling famously proposed an extremely simple but highly illustrative social mechanism to understand how strong ethnic segregation could arise in a world where individuals do not necessarily want it. Schelling’s simple computational model is the starting point for our extensions in which we build upon Wilensky’s original NetLogo implementation of this model. Our two NetLogo models can be best studied while reading our chapter “Agent-based Computational Models” (Flache and de Matos Fernandes, 2021). In the chapter, we propose 10 best practices to elucidate how agent-based models are a unique method for providing and analyzing formally precise, and empirically plausible mechanistic explanations of puzzling social phenomena, such as segregation, in the social world. Our chapter addresses in particular analytical sociologists who are new to ABMs.
In the first model (SegregationExtended), we build on Wilensky’s implementation of Schelling’s model which is available in NetLogo library (Wilensky, 1997). We considerably extend this model, allowing in particular to include larger neighborhoods and a population with four groups roughly resembling the ethnic composition of a contemporary large U.S. city. Further features added concern the possibility to include random noise, and the addition of a number of new outcome measures tuned to highlight macro-level implications of the segregation dynamics for different groups in the agent society.
In SegregationDiscreteChoice, we further modify the model incorporating in particular three new features: 1) heterogeneous preferences roughly based on empirical research categorizing agents into low, medium, and highly tolerant within each of the ethnic subgroups of the population, 2) we drop global thresholds (%-similar-wanted) and introduce instead a continuous individual-level single-peaked preference function for agents’ ideal neighborhood composition, and 3) we use a discrete choice model according to which agents probabilistically decide whether to move to a vacant spot or stay in the current spot by comparing the attractiveness of both locations based on the individual preference functions.
…
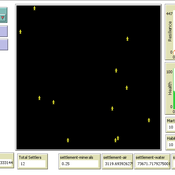
An Agent-Based Model of Space Settlements
Anamaria Berea | Published Wednesday, August 09, 2023 | Last modified Wednesday, November 01, 2023Background: Establishing a human settlement on Mars is an incredibly complex engineering problem. The inhospitable nature of the Martian environment requires any habitat to be largely self-sustaining. Beyond mining a few basic minerals and water, the colonizers will be dependent on Earth resupply and replenishment of necessities via technological means, i.e., splitting Martian water into oxygen for breathing and hydrogen for fuel. Beyond the technical and engineering challenges, future colonists will also face psychological and human behavior challenges.
Objective: Our goal is to better understand the behavioral and psychological interactions of future Martian colonists through an Agent-Based Modeling (ABM simulation) approach. We seek to identify areas of consideration for planning a colony as well as propose a minimum initial population size required to create a stable colony.
Methods: Accounting for engineering and technological limitations, we draw on research regarding high performing teams in isolated and high stress environments (ex: submarines, Arctic exploration, ISS, war) to include the 4 NASA personality types within the ABM. Interactions between agents with different psychological profiles are modeled at the individual level, while global events such as accidents or delays in Earth resupply affect the colony as a whole.
Results: From our multiple simulations and scenarios (up to 28 Earth years), we found that an initial population of 22 was the minimum required to maintain a viable colony size over the long run. We also found that the Agreeable personality type was the one more likely to survive.
Conclusion We developed a simulation with easy to use GUI to explore various scenarios of human interactions (social, labor, economic, psychological) on a future colony on Mars. We included technological and engineering challenges, but our focus is on the behavioral and psychological effects on the sustainability of the colony on the long run. We find, contrary to other literature, that the minimum number of people with all personality types that can lead to a sustainable settlement is in the tens and not hundreds.
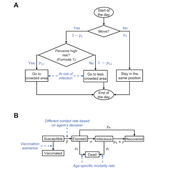
Peer reviewed Behavioral Dynamics of Epidemic Trajectories and Vaccination Strategies: An Agent-Based Model
Ziyuan Zhang | Published Tuesday, December 10, 2024This agent-based model explores the dynamics between human behavior and vaccination strategies during COVID-19 pandemics. It examines how individual risk perceptions influence behaviors and subsequently affect epidemic outcomes in a simulated metropolitan area resembling New York City from December 2020 to May 2021.
Agents modify their daily activities—deciding whether to travel to densely populated urban centers or stay in less crowded neighborhoods—based on their risk perception. This perception is influenced by factors such as risk perception threshold, risk tolerance personality, mortality rate, disease prevalence, and the average number of contacts per agent in crowded settings. Agent characteristics are carefully calibrated to reflect New York City demographics, including age distribution and variations in infection probability and mortality rates across these groups. The agents can experience six distinct health statuses: susceptible, exposed, infectious, recovered from infection, dead, and vaccinated (SEIRDV). The simulation focuses on the Iota and Alpha variants, the dominant strains in New York City during the period.
We simulate six scenarios divided into three main categories:
1. A baseline model without vaccinations where agents exhibit no risk perception and are indifferent to virus transmission and disease prevalence.
…
RecovUS: An Agent-Based Model of Post-Disaster Household Recovery
Saeed Moradi | Published Thursday, July 30, 2020The purpose of this model is to explain the post-disaster recovery of households residing in their own single-family homes and to predict households’ recovery decisions from drivers of recovery. Herein, a household’s recovery decision is repair/reconstruction of its damaged house to the pre-disaster condition, waiting without repair/reconstruction, or selling the house (and relocating). Recovery drivers include financial conditions and functionality of the community that is most important to a household. Financial conditions are evaluated by two categories of variables: costs and resources. Costs include repair/reconstruction costs and rent of another property when the primary house is uninhabitable. Resources comprise the money required to cover the costs of repair/reconstruction and to pay the rent (if required). The repair/reconstruction resources include settlement from the National Flood Insurance (NFI), Housing Assistance provided by the Federal Emergency Management Agency (FEMA-HA), disaster loan offered by the Small Business Administration (SBA loan), a share of household liquid assets, and Community Development Block Grant Disaster Recovery (CDBG-DR) fund provided by the Department of Housing and Urban Development (HUD). Further, household income determines the amount of rent that it can afford. Community conditions are assessed for each household based on the restoration of specific anchors. ASNA indexes (Nejat, Moradi, & Ghosh 2019) are used to identify the category of community anchors that is important to a recovery decision of each household. Accordingly, households are indexed into three classes for each of which recovery of infrastructure, neighbors, or community assets matters most. Further, among similar anchors, those anchors are important to a household that are located in its perceived neighborhood area (Moradi, Nejat, Hu, & Ghosh 2020).
Displaying 10 of 272 results for "Alexis Comber" clear search