Our mission is to help computational modelers develop, document, and share their computational models in accordance with community standards and good open science and software engineering practices. Model authors can publish their model source code in the Computational Model Library with narrative documentation as well as metadata that supports open science and emerging norms that facilitate software citation, computational reproducibility / frictionless reuse, and interoperability. Model authors can also request private peer review of their computational models. Models that pass peer review receive a DOI once published.
All users of models published in the library must cite model authors when they use and benefit from their code.
Please check out our model publishing tutorial and feel free to contact us if you have any questions or concerns about publishing your model(s) in the Computational Model Library.
Displaying 10 of 272 results for "Santiago L Rovere" clear search
COOPER - Flood impacts over Cooperative Winemaking Systems
David Nortes Martinez David Nortes-Martinez | Published Thursday, February 08, 2018 | Last modified Friday, March 22, 2019The model simulates flood damages and its propagation through a cooperative, productive, farming system, characterized as a star-type network, where all elements in the system are connected one to each other through a central element.
Anthill: A harvester ant colony built from the published science
Adrian Diez Cuadrado | Published Thursday, September 17, 2026An agent-based model of one colony of the Florida harvester ant, Pogonomyrmex badius, from the day a mated queen lands to the death of the colony. It runs in a web browser and, unchanged, headless in Node for replicate studies.
What the ants do: a claustral queen digs her own shaft and raises the first workers on her reserves; workers dig the nest under local rules, with no ant holding a plan; a one-way, age-based division of labour set by the season of birth, which no shortage reverses; trunk-trail foraging with site fidelity and recruitment; seed storage, opening and germination in the chambers, which is what feeds the larvae; daily weather from the climate normals of the study site, with drought years; nuptial flights after heavy rain; corpse removal; alarm at a disturbance on the foraging ground; and annual nest relocation, in which the store and then the brood are carried along the trail to a new nest the colony digs.
Every value in the model is tagged as measured in this species, borrowed from another ant, or invented, with its source, in a single parameter file. The model is deterministic: one seeded stream per system and a fixed one-minute timestep, so a seed reproduces a run bit for bit in the browser and in Node, which a test pins. A study writes a methods report listing the invented values the results rest on and the acceptance tests the model fails.
…
Agent-based model of risk behavior in adolescence
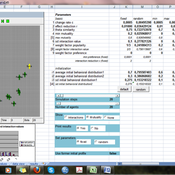
N Schuhmacher P Van Geert L Ballato | Published Monday, June 24, 2013 | Last modified Monday, April 08, 2019The computer model simulates the development of a social network (i.e. formation of friendships and cliques), the (dyadic) interactions between pupils and the development of similarities and differences in their behavioral profiles.
An empirical ABM for regional land use/cover change: a Dutch case study
Diego Valbuena | Published Saturday, March 12, 2011 | Last modified Thursday, November 11, 2021This is an empirical model described in http://dx.doi.org/10.1016/j.landurbplan.2010.05.001. The objective of the model is to simulate how the decision-making of farmers/agents with different strategies can affect the landscape structure in a region in the Netherlands.
Setting the Stage for Inequality
Timothy Dennehy | Published Monday, March 11, 2013 | Last modified Saturday, April 27, 2013How can a strictly egalitarian social system give way to a stratified society if all of its members punish each other for any type of selfish behavior? This model examines the role of prestige bias in constant and variable environments on the development of hierarchies of wealth.
Agent modeling (ABM) as a tool to improve the mobility of “avoidant” birds in an ecological corridor in the localities of Chapinero, Teusaquillo, Barrios Unidos and Engativá of Bogotá city [Scenario 2]
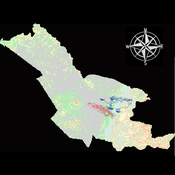
Paula Alejandra Meza | Published Thursday, June 25, 2026Considering that two of the three avoider species could not reach the target area in the inittial scenario, five alternative corridor scenarios were created. In all cases, we generated a greater amount of cover area under ‘Urban forest’, including elements such as scattered trees, woody plants, wooded areas, and rows of trees. This covered type was selected since all three species use it as a regular habitat. That is the second sceneario where those ecological parks and other areas inside the capital city were boostered into “urban forest patches” or buffer points, with the idea of improving the survive of the three bird species and their movement. However one of the most restrictive specie was still having movement and survival issues.
Animal territory formation (Reusable Building Block RBB)
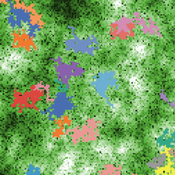
Volker Grimm Stephanie Kramer-Schadt Robert Zakrzewski | Published Sunday, November 12, 2023This is a generic sub-model of animal territory formation. It is meant to be a reusable building block, but not in the plug-and-play sense, as amendments are likely to be needed depending on the species and region. The sub-model comprises a grid of cells, reprenting the landscape. Each cell has a “quality” value, which quantifies the amount of resources provided for a territory owner, for example a tiger. “Quality” could be prey density, shelter, or just space. Animals are located randomly in the landscape and add grid cells to their intial cell until the sum of the quality of all their cells meets their needs. If a potential new cell to be added is owned by another animal, competition takes place. The quality values are static, and the model does not include demography, i.e. mortality, mating, reproduction. Also, movement within a territory is not represented.
Peer reviewed BAM: The Bottom-up Adaptive Macroeconomics Model
Alejandro Platas López Alejandro Guerra-Hernández | Published Tuesday, January 14, 2020 | Last modified Sunday, July 26, 2020Overview
Purpose
Modeling an economy with stable macro signals, that works as a benchmark for studying the effects of the agent activities, e.g. extortion, at the service of the elaboration of public policies..
…

BESTMAP-ABM-DE is an agent-based model to determine the adoption and spatial allocation of selected agri-environmental schemes (AES) by individual farmers in the Mulde River Basin located in Western Saxony, Germany. The selected AES are buffer areas, cover crops, maintaining permanent grassland and conversion of arable land to permanent grassland. While the first three schemes have already been offered in the case study area, the latter scheme is a hypothetical scheme designed to test the impact of potential policy changes. For the first model analyses, only the currently offered schemes are considered. With the model, the effect of different scenarios of policy design on patterns of adoption can be investigated. In particular, the model can be used to study the social-ecological consequences of agricultural policies at different spatial and temporal scales and, in combination with biophysical models, test the ecological implications of different designs of the EU’s Common Agricultural Policy. The model was developed in the BESTMAP project.
Peer reviewed soslivestock model
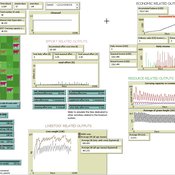
Marco Janssen Irene Perez Ibarra Diego J. Soler-Navarro Alicia Tenza Peral | Published Wednesday, May 28, 2025 | Last modified Tuesday, June 10, 2025The purpose of this model is to analyze how different management strategies affect the wellbeing, sustainability and resilience of an extensive livestock system under scenarios of climate change and landscape configurations. For this purpose, it simulates one cattle farming system, in which agents (cattle) move through the space using resources (grass). Three farmer profiles are considered: 1) a subsistence farmer that emphasizes self-sufficiency and low costs with limited attention to herd management practices, 2) a commercial farmer focused on profit maximization through efficient production methods, and 3) an environmental farmer that prioritizes conservation of natural resources and animal welfare over profit maximization. These three farmer profiles share the same management strategies to adapt to climate and resource conditions, but differ in their goals and decision-making criteria for when, how, and whether to implement those strategies. This model is based on the SequiaBasalto model (Dieguez Cameroni et al. 2012, 2014, Bommel et al. 2014 and Morales et al. 2015), replicated in NetLogo by Soler-Navarro et al. (2023).
One year is 368 days. Seasons change every 92 days. Each step begins with the growth of grass as a function of climate and season. This is followed by updating the live weight of animals according to the grass height of their patch, and grass consumption, which is determined based on the updated live weight. Animals can be supplemented by the farmer in case of severe drought. After consumption, cows grow and reproduce, and a new grass height is calculated. This updated grass height value becomes the starting grass height for the next day. Cows then move to the next area with the highest grass height. After that, cattle prices are updated and cattle sales are held on the first day of fall. In the event of a severe drought, special sales are held. Finally, at the end of the day, the farm balance and the farmer’s effort are calculated.
Displaying 10 of 272 results for "Santiago L Rovere" clear search