Our mission is to help computational modelers develop, document, and share their computational models in accordance with community standards and good open science and software engineering practices. Model authors can publish their model source code in the Computational Model Library with narrative documentation as well as metadata that supports open science and emerging norms that facilitate software citation, computational reproducibility / frictionless reuse, and interoperability. Model authors can also request private peer review of their computational models. Models that pass peer review receive a DOI once published.
All users of models published in the library must cite model authors when they use and benefit from their code.
Please check out our model publishing tutorial and feel free to contact us if you have any questions or concerns about publishing your model(s) in the Computational Model Library.
Displaying 10 of 979 results for "Gert Jan Kramer" clear search

BESTMAP-ABM-DE is an agent-based model to determine the adoption and spatial allocation of selected agri-environmental schemes (AES) by individual farmers in the Mulde River Basin located in Western Saxony, Germany. The selected AES are buffer areas, cover crops, maintaining permanent grassland and conversion of arable land to permanent grassland. While the first three schemes have already been offered in the case study area, the latter scheme is a hypothetical scheme designed to test the impact of potential policy changes. For the first model analyses, only the currently offered schemes are considered. With the model, the effect of different scenarios of policy design on patterns of adoption can be investigated. In particular, the model can be used to study the social-ecological consequences of agricultural policies at different spatial and temporal scales and, in combination with biophysical models, test the ecological implications of different designs of the EU’s Common Agricultural Policy. The model was developed in the BESTMAP project.
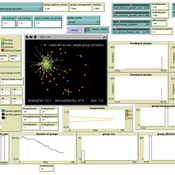
Nice Musical Chairs
Andreas Angourakis | Published Friday, February 05, 2016 | Last modified Friday, November 17, 2017The Nice Musical Chairs (NMC) model represent the competition for space between groups of stakeholders of farming and herding activities in the arid Afro-Eurasia.
The Travel-tour case study
Christophe Sibertin-Blanc Françoise Adreit Joseph El Gemayel | Published Sunday, May 19, 2013 | Last modified Friday, June 14, 2013This model describes and analyses the Travel-Tour Case study.
Rebel Group Protection Rackets
Gerd Wagner Luis Gustavo Nardin Kamil C. Klosek Frances Duffy | Published Wednesday, December 04, 2019System Narrative
How do rebel groups control territory and engage with the local economy during civil war? Charles Tilly’s seminal War and State Making as Organized Crime (1985) posits that the process of waging war and providing governance resembles that of a protection racket, in which aspiring governing groups will extort local populations in order to gain power, and civilians or businesses will pay in order to ensure their own protection. As civil war research increasingly probes the mechanisms that fuel local disputes and the origination of violence, we develop an agent-based simulation model to explore the economic relationship of rebel groups with local populations, using extortion racket interactions to explain the dynamics of rebel fighting, their impact on the economy, and the importance of their economic base of support. This analysis provides insights for understanding the causes and byproducts of rebel competition in present-day conflicts, such as the cases of South Sudan, Afghanistan, and Somalia.
Model Description
The model defines two object types: RebelGroup and Enterprise. A RebelGroup is a group that competes for power in a system of anarchy, in which there is effectively no government control. An Enterprise is a local civilian-level actor that conducts business in this environment, whose objective is to make a profit. In this system, a RebelGroup may choose to extort money from Enterprises in order to support its fighting efforts. It can extract payments from an Enterprise, which fears for its safety if it does not pay. This adds some amount of money to the RebelGroup’s resources, and they can return to extort the same Enterprise again. The RebelGroup can also choose to loot the Enterprise instead. This results in gaining all of the Enterprise wealth, but prompts the individual Enterprise to flee, or leave the model. This reduces the available pool of Enterprises available to the RebelGroup for extortion. Following these interactions the RebelGroup can choose to AllocateWealth, or pay its rebel fighters. Depending on the value of its available resources, it can add more rebels or expel some of those which it already has, changing its size. It can also choose to expand over new territory, or effectively increase its number of potential extorting Enterprises. As a response to these dynamics, an Enterprise can choose to Report expansion to another RebelGroup, which results in fighting between the two groups. This system shows how, faced with economic choices, RebelGroups and Enterprises make decisions in war that impact conflict and violence outcomes.
Individual bias and organizational objectivity
Bo Xu | Published Monday, April 15, 2013 | Last modified Monday, April 08, 2019This model introduces individual bias to the model of exploration and exploitation, simulates knowledge diffusion within organizations, aiming to investigate the effect of individual bias and other related factors on organizational objectivity.
Forager mobility and interaction
L S Premo | Published Thursday, January 10, 2013 | Last modified Saturday, April 27, 2013This is a relatively simple foraging-radius model, as described first by Robert Kelly, that allows one to quantify the effect of increased logistical mobility (as represented by increased effective foraging radius, r_e) on the likelihood that 2 randomly placed central place foragers will encounter one another within 5000 time steps.
Peer reviewed AgModel
Isaac Ullah | Published Friday, December 06, 2024AgModel is an agent-based model of the forager-farmer transition. The model consists of a single software agent that, conceptually, can be thought of as a single hunter-gather community (i.e., a co-residential group that shares in subsistence activities and decision making). The agent has several characteristics, including a population of human foragers, intrinsic birth and death rates, an annual total energy need, and an available amount of foraging labor. The model assumes a central-place foraging strategy in a fixed territory for a two-resource economy: cereal grains and prey animals. The territory has a fixed number of patches, and a starting number of prey. While the model is not spatially explicit, it does assume some spatiality of resources by including search times.
Demographic and environmental components of the simulation occur and are updated at an annual temporal resolution, but foraging decisions are “event” based so that many such decisions will be made in each year. Thus, each new year, the foraging agent must undertake a series of optimal foraging decisions based on its current knowledge of the availability of cereals and prey animals. Other resources are not accounted for in the model directly, but can be assumed for by adjusting the total number of required annual energy intake that the foraging agent uses to calculate its cereal and prey animal foraging decisions. The agent proceeds to balance the net benefits of the chance of finding, processing, and consuming a prey animal, versus that of finding a cereal patch, and processing and consuming that cereal. These decisions continue until the annual kcal target is reached (balanced on the current human population). If the agent consumes all available resources in a given year, it may “starve”. Starvation will affect birth and death rates, as will foraging success, and so the population will increase or decrease according to a probabilistic function (perturbed by some stochasticity) and the agent’s foraging success or failure. The agent is also constrained by labor caps, set by the modeler at model initialization. If the agent expends its yearly budget of person-hours for hunting or foraging, then the agent can no longer do those activities that year, and it may starve.
Foragers choose to either expend their annual labor budget either hunting prey animals or harvesting cereal patches. If the agent chooses to harvest prey animals, they will expend energy searching for and processing prey animals. prey animals search times are density dependent, and the number of prey animals per encounter and handling times can be altered in the model parameterization (e.g. to increase the payoff per encounter). Prey animal populations are also subject to intrinsic birth and death rates with the addition of additional deaths caused by human predation. A small amount of prey animals may “migrate” into the territory each year. This prevents prey animals populations from complete decimation, but also may be used to model increased distances of logistic mobility (or, perhaps, even residential mobility within a larger territory).
…
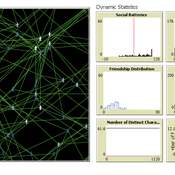
The Friendship Field
Eva Timmer Chrisja van de Kieft | Published Thursday, May 26, 2022 | Last modified Tuesday, August 30, 2022The Friendship Field model aims at modelling friendship formation based on three factors: Extraversion, Resemblance and Status, where social interaction is motivated by the Social Battery. Social Battery is one’s energy and motivation to engage in social contact. Since social contact is crucial for friendship formation, the model included Social Battery to affect social interactions. To our best knowledge, Social Battery is a yet unintroduced concept in research while it is a dynamic factor influencing the social interaction besides one’s characteristics. Extraverts’ Social Batteries charge while interacting and exhaust while being alone. Introverts’ Social Batteries charge while being alone and exhaust while interacting. The aim of the model is to illustrate the concept of Social Battery. Moreover, the Friendship Field shows patterns regarding Extraversion, Resemblance and Status including the mere-exposure effect and friendship by similarity. For the implementation of Status, Kemper’s status-power theory is used. The concept of Social Battery is also linked to Kemper’s theory on the organism as reference group. By running the model for a year (3 interactions moments per day), the friendship dynamics over time can be studied.
We presented the model at the Social Simulation Conference 2022.
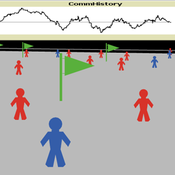
Model of communication between two groups of managers in the course of project implementation
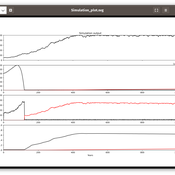
Smarzhevskiy Ivan | Published Monday, December 07, 2020This is a simulation model of communication between two groups of managers in the course of project implementation. The “world” of the model is a space of interaction between project participants, each of which belongs either to a group of work performers or to a group of customers. Information about the progress of the project is publicly available and represents the deviation Earned value (EV) from the planned project value (cost baseline).
The key elements of the model are 1) persons belonging to a group of customers or performers, 2) agents that are communication acts. The life cycle of persons is equal to the time of the simulation experiment, the life cycle of the communication act is 3 periods of model time (for the convenience of visualizing behavior during the experiment). The communication act occurs at a specific point in the model space, the coordinates of which are realized as random variables. During the experiment, persons randomly move in the model space. The communication act involves persons belonging to a group of customers and a group of performers, remote from the place of the communication act at a distance not exceeding the value of the communication radius (MaxCommRadius), while at least one representative from each of the groups must participate in the communication act. If none are found, the communication act is not carried out. The number of potential communication acts per unit of model time is a parameter of the model (CommPerTick).
The managerial sense of the feedback is the stimulating effect of the positive value of the accumulated communication complexity (positive background of the project implementation) on the productivity of the performers. Provided there is favorable communication (“trust”, “mutual understanding”) between the customer and the contractor, it is more likely that project operations will be performed with less lag behind the plan or ahead of it.
The behavior of agents in the world of the model (change of coordinates, visualization of agents’ belonging to a specific communicative act at a given time, etc.) is not informative. Content data are obtained in the form of time series of accumulated communicative complexity, the deviation of the earned value from the planned value, average indicators characterizing communication - the total number of communicative acts and the average number of their participants, etc. These data are displayed on graphs during the simulation experiment.
The control elements of the model allow seven independent values to be varied, which, even with a minimum number of varied values (three: minimum, maximum, optimum), gives 3^7 = 2187 different variants of initial conditions. In this case, the statistical processing of the results requires repeated calculation of the model indicators for each grid node. Thus, the set of varied parameters and the range of their variation is determined by the logic of a particular study and represents a significant narrowing of the full set of initial conditions for which the model allows simulation experiments.
…
Peer reviewed E³-MAN. An Institutionally-guided multi-agent. Model for fair and efficient negotiation.
José luis bustelo | Published Monday, September 01, 2025Negotiation plays a fundamental role in shaping human societies, underpinning conflict resolution, institutional design, and economic coordination. This article introduces E³-MAN, a novel multi-agent model for negotiation that integrates individual utility maximization with fairness and institutional legitimacy. Unlike classical approaches grounded solely in game theory, our model incorporates Bayesian opponent modeling, transfer learning from past negotiation domains, and fallback institutional rules to resolve deadlocks. Agents interact in dynamic environments characterized by strategic heterogeneity and asymmetric information, negotiating over multidimensional issues under time constraints. Through extensive simulation experiments, we compare E³-MAN against the Nash bargaining solution and equal-split baselines using key performance metrics: utilitarian efficiency, Nash social welfare, Jain fairness index, Gini coefficient, and institutional compliance. Results show that E³-MAN achieves near-optimal efficiency while significantly improving distributive equity and agreement stability. A legal application simulating multilateral labor arbitration demonstrates that institutional default rules foster more balanced outcomes and increase negotiation success rates from 58% to 98%. By combining computational intelligence with normative constraints, this work contributes to the growing field of socially aware autonomous agents. It offers a virtual laboratory for exploring how simple institutional interventions can enhance justice, cooperation, and robustness in complex socio-legal systems.
Displaying 10 of 979 results for "Gert Jan Kramer" clear search