About the CoMSES Model Library more info
Our mission is to help computational modelers develop, document, and share their computational models in accordance with community standards and good open science and software engineering practices. Model authors can publish their model source code in the Computational Model Library with narrative documentation as well as metadata that supports open science and emerging norms that facilitate software citation, computational reproducibility / frictionless reuse, and interoperability. Model authors can also request private peer review of their computational models. Models that pass peer review receive a DOI once published.
All users of models published in the library must cite model authors when they use and benefit from their code.
Please check out our model publishing tutorial and feel free to contact us if you have any questions or concerns about publishing your model(s) in the Computational Model Library.
We also maintain a curated database of over 7500 publications of agent-based and individual based models with detailed metadata on availability of code and bibliometric information on the landscape of ABM/IBM publications that we welcome you to explore.
Displaying 5 of 5 results Spatial analysis clear search
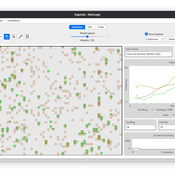
Logônia: Plant Growth Response Model in NetLogo
Leandro Garcia Daniel Vartanian Aline | Published Saturday, September 13, 2025 | Last modified Tuesday, September 16, 2025Logônia is a NetLogo model that simulates the growth response of a fictional plant, logônia, under different climatic conditions. The model uses climate data from WorldClim 2.1 and demonstrates how to integrate the LogoClim model through the LevelSpace extension.
Logônia follows the FAIR Principles for Research Software (Barker et al., 2022) and is openly available on the CoMSES Network and GitHub.
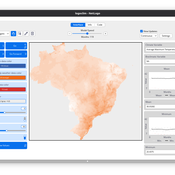
LogoClim: WorldClim in NetLogo
Daniel Vartanian Leandro Garcia Aline Martins de Carvalho Aline | Published Thursday, July 03, 2025 | Last modified Tuesday, September 16, 2025LogoClim is a NetLogo model for simulating and visualizing global climate conditions. It allows researchers to integrate high-resolution climate data into agent-based models, supporting reproducible research in ecology, agriculture, environmental sciences, and other fields that rely on climate data.
The model utilizes raster data to represent climate variables such as temperature and precipitation over time. It incorporates historical data (1951-2024) and future climate projections (2021-2100) derived from global climate models under various Shared Socioeconomic Pathways (SSPs, O’Neill et al., 2017). All climate inputs come from WorldClim 2.1, a widely used source of high-resolution, interpolated climate datasets based on weather station observations worldwide (Fick & Hijmans, 2017).
LogoClim follows the FAIR Principles for Research Software (Barker et al., 2022) and is openly available on the CoMSES Network and GitHub. See the Logônia model for an example of its integration into a full NetLogo simulation.
Mobility, Ethnicity, and Language-Based Immigrant Settlement Model - MELBIS
Liliana Perez Jonathan Gaudreau Suzana Dragicevic Taylor Anderson Aaron Leung | Published Monday, June 14, 2021 | Last modified Monday, June 14, 2021MELBIS-V1 is a spatially explicit agent-based model that allows the geospatial simulation of the decision-making process of newcomers arriving in the bilingual cities and boroughs of the island of Montreal, Quebec in CANADA, and the resulting urban segregation spatial patterns. The model was implemented in NetLogo, using geospatial raster datasets of 120m spatial resolution.
MELBIS-V2 enhances MELBIS-V1 to implement and simulate the decision-making processes of incoming immigrants, and to analyze the resulting spatial patterns of segregation as immigrants arrive and settle in various cities in Canada. The arrival and segregation of immigrants is modeled with MELBIS-V2 and compared for three major Canadian immigration gateways, including the City of Toronto, Metro Vancouver, and the City of Calgary.
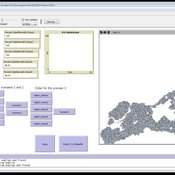
Cluster Analysis
Lars Spång | Published Sunday, January 14, 2018This model illustrates how to apply a simple cluster-analysis on points distributed around 5 centers. The result can be displayed in shades of a color or a spectacular colored pattern.
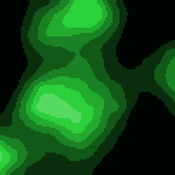
cluster analysis
Lars Spång | Published Tuesday, November 07, 2017This model demonstrates how to illustrate a cluster pattern by counting turtles within i moving circle with a specified radius. The procedure is common in archaeological spatial analysis.