About the CoMSES Model Library more info
Our mission is to help computational modelers develop, document, and share their computational models in accordance with community standards and good open science and software engineering practices. Model authors can publish their model source code in the Computational Model Library with narrative documentation as well as metadata that supports open science and emerging norms that facilitate software citation, computational reproducibility / frictionless reuse, and interoperability. Model authors can also request private peer review of their computational models. Models that pass peer review receive a DOI once published.
All users of models published in the library must cite model authors when they use and benefit from their code.
Please check out our model publishing tutorial and feel free to contact us if you have any questions or concerns about publishing your model(s) in the Computational Model Library.
We also maintain a curated database of over 7500 publications of agent-based and individual based models with detailed metadata on availability of code and bibliometric information on the landscape of ABM/IBM publications that we welcome you to explore.
Displaying 10 of 868 results for "Jes%C3%BAs M Zamarre%C3%B1o" clear search
Climate Change Adaptation in Coastal Regions
Emma Cutler | Published Thursday, June 01, 2017This generic model simulates climate change adaptation in the form of resistance, accommodation, and retreat in coastal regions vulnerable to sea level rise and flooding. It tracks how population changes as households retreat to higher ground.
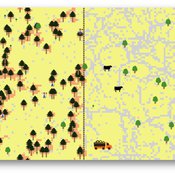
TRUE GRASP (Tree Recruitment Under Exotic GRAsses in a Savanna-Pineland)
is a socio-ecological agent-based model (ABM) and role playing game (RPG) for farmers and other stakeholders involved in rural landscape planning.
The purpose of this model is to allow actors to explore the individual and combined effects - as well as tradeoffs - of three methods of controlling exotic grasses in pine savannas: fire, weeding, and grazing cattle.
Design of TRUE GRASP is based on 3 years of socio-ecological fieldwork in a human-induced pine savanna in La Sepultura Biosphere Reserve (SBR) in the Mexican state of Chiapas. In this savanna, farmers harvest resin from Pinus oocarpa, which is used to produce turpentine and other products. However, long term persistence of this activity is jeopardized by low tree recruitment due to exotic tall grass cover in the forest understory (see Braasch et al., 2017). The TRUE GRASP model provides the user with different management strategies for controlling exotic grass cover and avoiding possible regime shifts, which in the case of the SBR would jeopardize resin harvesting.
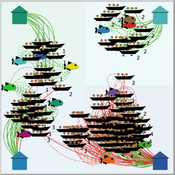
Peer reviewed FishMob: Interactions between fisher mobility and spatial resource heterogeneity
Emilie Lindkvist | Published Wednesday, October 16, 2019 | Last modified Tuesday, June 23, 2020Migration or other long-distance movement into other regions is a common strategy of fishers and fishworkers living and working on the coast to adapt to environmental change. This model attempts to understand the general dynamics of fisher mobility for over larger spatial scales. The model can be used for investigating the complex interplay that exists between mobility and fish stock heterogeneity across regions, and the associated outcomes of mobility at the system level.
The model design informed by the example of small-scale fisheries in the Gulf of California, Mexico but implements theoretical and stylized facts and can as such be used for different archetypical cases. Our methodological approach for designing the model aims to account for the complex causation, emergence and interdependencies in small-scale fisheries to explain the phenomenon of sequential overexploitation, i.e., overexploiting one resource after another. The model is intended to be used as a virtual laboratory to investigate when and how different levels of mobile fishers affect exploitation patterns of fisheries resources.
Hybrid agent-based methodology for testing response protocols
Fernando Sancho Caparrini | Published Wednesday, February 03, 2021In recent years we have seen multiple incidents with a large number of people injured and killed by one or more armed attackers. Since this type of violence is difficult to predict, detecting threats as early as possible allows to generate early warnings and reduce response time. In this context, any tool to check and compare different action protocols can be a further step in the direction of saving lives. Our proposal combines features from continuous and discrete models to obtain the best of both worlds in order to simulate large and crowded spaces where complex behavior individuals interact. With this proposal we aim to provide a tool for testing different security protocols under several emergency scenarios, where spaces, hazards, and population can be customized. Finally, we use a proof of concept implementation of this model to test specific security protocols under emergency situations for real spaces. Specifically, we test how providing some users of a university college with an app that informs about the type and characteristics of the ongoing hazard, affects in the safety performance.
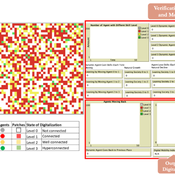
Digital Mobility Model (DMM)
Na (Richard) Jiang Fiammetta Brandajs | Published Thursday, February 01, 2024 | Last modified Friday, February 02, 2024The purpose of the Digital Mobility Model (DMM) is to explore how a society’s adoption of digital technologies can impact people’s mobilities and immobilities within an urban environment. Thus, the model contains dynamic agents with different levels of digital technology skills, which can affect their ability to access urban services using digital systems (e.g., healthcare or municipal public administration with online appointment systems). In addition, the dynamic agents move within the model and interact with static agents (i.e., places) that represent locations with different levels of digitalization, such as restaurants with online reservation systems that can be considered as a place with a high level of digitalization. This indicates that places with a higher level of digitalization are more digitally accessible and easier to reach by individuals with higher levels of digital skills. The model simulates the interaction between dynamic agents and static agents (i.e., places), which captures how the gap between an individual’s digital skills and a place’s digitalization level can lead to the mobility or immobility of people to access different locations and services.
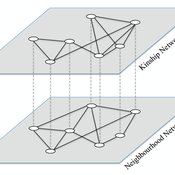
Peer reviewed ACross (Academic Collaboration, Research, Output, and System Simulation)
Wenhan Feng Bayi Li | Published Saturday, June 28, 2025The primary purpose of this model is to explain the dynamic processes within university-centered collaboration networks, with a particular focus on the complex transformation of academic knowledge into practical projects. Based on investigations of actual research projects and a thorough literature review, the model integrates multiple drivers and influencing factors to explore how these factors affect the formation and evolution of collaboration networks under different parameter scenarios. The model places special emphasis on the impact of disciplinary attributes, knowledge exchange, and interdisciplinary collaboration on the dynamics of collaboration networks, as well as the complex mechanisms of network structure, system efficiency, and interdisciplinary interactions during project formation.
Specifically, the model aims to:
- Simulate how university research departments drive the formation of research projects through knowledge creation.
- Investigate how the dynamics of collaboration networks influence the transformation of innovative hypotheses into matured projects.
- Examine the critical roles of knowledge exchange and interdisciplinary collaboration in knowledge production and project formation.
- Provide both quantitative and qualitative insights into the interactions among academia, industry, and project outputs.
CITMOD A Tax-Benefit Modeling System for the average citizen
Philip Truscott | Published Monday, August 15, 2011 | Last modified Saturday, April 27, 2013Must tax-benefit policy making be limited to the ‘experts’?
PA/C model with affinity
N. Leticia Abrica-Jacinto Evguenii Kurmyshev Héctor Juárez | Published Thursday, October 27, 2016We expose RA agent-based model of the opinion and tolerance dynamics in artificial societies. The formal mathematical model is based on the ideas of Social Influence, Social Judgment, and Social Identity theories.
Diffusion of Innovations on Social Networks
Hang Xiong | Published Saturday, April 16, 2016This is model that simulates how multiple kinds of peer effects shape the diffusion of innovations through different types of social relationships.
Geographic Expansion Model (GEM)
Sean Bergin | Published Friday, February 28, 2020The purpose of this model is to explore the importance of geographic factors to the settlement choices of early Neolithic agriculturalists. In the model, each agriculturalist spreads to one of the best locations within a modeler specified radius. The best location is determined by choosing either one factor such as elevation or slope; or by ranking geographic factors in order of importance.
Displaying 10 of 868 results for "Jes%C3%BAs M Zamarre%C3%B1o" clear search