About the CoMSES Model Library more info
Our mission is to help computational modelers develop, document, and share their computational models in accordance with community standards and good open science and software engineering practices. Model authors can publish their model source code in the Computational Model Library with narrative documentation as well as metadata that supports open science and emerging norms that facilitate software citation, computational reproducibility / frictionless reuse, and interoperability. Model authors can also request private peer review of their computational models. Models that pass peer review receive a DOI once published.
All users of models published in the library must cite model authors when they use and benefit from their code.
Please check out our model publishing tutorial and feel free to contact us if you have any questions or concerns about publishing your model(s) in the Computational Model Library.
We also maintain a curated database of over 7500 publications of agent-based and individual based models with detailed metadata on availability of code and bibliometric information on the landscape of ABM/IBM publications that we welcome you to explore.
Displaying 10 of 993 results for "M Van Den Hoven" clear search
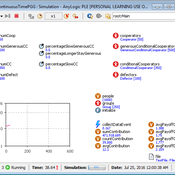
An Agent-Based Simulation of Continuous-Time Public Goods Games
Tuong Manh Vu | Published Thursday, May 17, 2018 | Last modified Tuesday, April 02, 2019To our knowledge, this is the first agent-based simulation of continuous-time PGGs (where participants can change contributions at any time) which are much harder to realise within both laboratory and simulation environments.
Work related to this simulation has been published in the following journal article:
Vu, Tuong Manh, Wagner, Christian and Siebers, Peer-Olaf (2019) ‘ABOOMS: Overcoming the Hurdles of Continuous-Time Public Goods Games with a Simulation-Based Approach’ Journal of Artificial Societies and Social Simulation 22 (2) 7 http://jasss.soc.surrey.ac.uk/22/2/7.html. doi: 10.18564/jasss.3995
Abstract:
…
An Agent-based Model of the Tragedy of the Commons
tao liu | Published Sunday, April 12, 2026This is a model that explores how a few fishermen sharing a common fishery learn their harvesting strategies under different incentive settings, and how individual greed, cooperation, and sustainability penalties shape resource depletion and the tragedy of the commons.
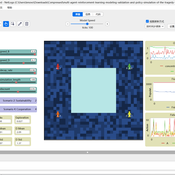
FoxNet is an individual-based modelling framework that can be customised to generate high-resolution red fox Vulpes vulpes population models for both northern and southern hemispheres. FoxNet predicts red fox population dynamics, including responses to control and landscape productivity. Model landscapes (up to ~15,000 km^2 and bait layouts can be generated within FoxNet or imported as GIS layers.
If you use FoxNet, please cite:
Hradsky BA, Kelly L, Robley A, Wintle BA (in review). FoxNet: an individual-based modelling framework to support red fox management. Journal of Applied Ecology.

Peer reviewed Neighbor Influenced Energy Retrofit (NIER) agent-based model
Eric Boria | Published Friday, April 03, 2020The NIER model is intended to add qualitative variables of building owner types and peer group scales to existing energy efficiency retrofit adoption models. The model was developed through a combined methodology with qualitative research, which included interviews with key stakeholders in Cleveland, Ohio and Detroit and Grand Rapids, Michigan. The concepts that the NIER model adds to traditional economic feasibility studies of energy retrofit decision-making are differences in building owner types (reflecting strategies for managing buildings) and peer group scale (neighborhoods of various sizes and large-scale Districts). Insights from the NIER model include: large peer group comparisons can quickly raise the average energy efficiency values of Leader and Conformist building owner types, but leave Stigma-avoider owner types as unmotivated to retrofit; policy interventions such as upgrading buildings to energy-related codes at the point of sale can motivate retrofits among the lowest efficient buildings, which are predominantly represented by the Stigma-avoider type of owner; small neighborhood peer groups can successfully amplify normal retrofit incentives.
Crowdworking Model
Georg Jäger | Published Wednesday, September 25, 2019The purpose of this agent-based model is to compare different variants of crowdworking in a general way, so that the obtained results are independent of specific details of the crowdworking platform. It features many adjustable parameters that can be used to calibrate the model to empirical data, but also when not calibrated it yields essential results about crowdworking in general.
Agents compete for contracts on a virtual crowdworking platform. Each agent is defined by various properties like qualification and income expectation. Agents that are unable to turn a profit have a chance to quit the crowdworking platform and new crowdworkers can replace them. Thus the model has features of an evolutionary process, filtering out the ill suited agents, and generating a realistic distribution of agents from an initially random one. To simulate a stable system, the amount of contracts issued per day can be set constant, as well as the number of crowdworkers. If one is interested in a dynamically changing platform, the simulation can also be initialized in a way that increases or decreases the number of crowdworkers or number of contracts over time. Thus, a large variety of scenarios can be investigated.
TIMELY Model
Pia Backmann | Published Thursday, September 19, 2019An individual-based model to evaluate, whether time delays in plant responses to insect herbivory can be beneficial for the plant.
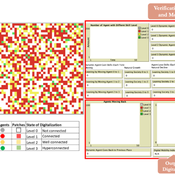
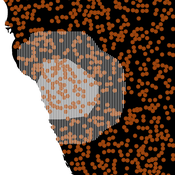
Digital Mobility Model (DMM)
Na (Richard) Jiang Fiammetta Brandajs | Published Thursday, February 01, 2024 | Last modified Friday, February 02, 2024The purpose of the Digital Mobility Model (DMM) is to explore how a society’s adoption of digital technologies can impact people’s mobilities and immobilities within an urban environment. Thus, the model contains dynamic agents with different levels of digital technology skills, which can affect their ability to access urban services using digital systems (e.g., healthcare or municipal public administration with online appointment systems). In addition, the dynamic agents move within the model and interact with static agents (i.e., places) that represent locations with different levels of digitalization, such as restaurants with online reservation systems that can be considered as a place with a high level of digitalization. This indicates that places with a higher level of digitalization are more digitally accessible and easier to reach by individuals with higher levels of digital skills. The model simulates the interaction between dynamic agents and static agents (i.e., places), which captures how the gap between an individual’s digital skills and a place’s digitalization level can lead to the mobility or immobility of people to access different locations and services.
Modeling financial networks based on interpersonal trust
Michael Roos Anna Klabunde | Published Wednesday, May 29, 2013 | Last modified Thursday, November 28, 2013We build a stylized model of a network of business angel investors and start-up entrepreneurs. Decisions are based on trust as a decision making tool under true uncertainty.
External shocks, agent interactions, and endogenous feedbacks--investigating system resilience with a stylized land use model
Yang Chen | Published Tuesday, March 06, 2018The purpose of the presented ABM is to explore how system resilience is affected by external disturbances and internal dynamics by using the stylized model of an agricultural land use system.
We explore land system resilience with a stylized land use model in which agents’ land use activities are affected by external shocks, agent interactions, and endogenous feedbacks. External shocks are designed as yield loss in crops, which is ubiquitous in almost every land use system where perturbations can occur due to e.g. extreme weather conditions or diseases. Agent interactions are designed as the transfer of buffer capacity from farmers who can and are willing to provide help to other farmers within their social network. For endogenous feedbacks, we consider land use as an economic activity which is regulated by markets — an increase in crop production results in lower price (a negative feedback) and an agglomeration of a land use results in lower production costs for the land use type (a positive feedback).
Influence with over-confident agents
Juliette Rouchier Emily Tanimura | Published Wednesday, October 21, 2015Agents can influence each other if they are close enough in knowledge. The probability to convince with good knowledge and number of agents have an impact on the dissemination of knowledge.
Displaying 10 of 993 results for "M Van Den Hoven" clear search