About the CoMSES Model Library more info
Our mission is to help computational modelers at all levels engage in the establishment and adoption of community standards and good practices for developing and sharing computational models. Model authors can freely publish their model source code in the Computational Model Library alongside narrative documentation, open science metadata, and other emerging open science norms that facilitate software citation, reproducibility, interoperability, and reuse. Model authors can also request peer review of their computational models to receive a DOI.
All users of models published in the library must cite model authors when they use and benefit from their code.
Please check out our model publishing tutorial and contact us if you have any questions or concerns about publishing your model(s) in the Computational Model Library.
We also maintain a curated database of over 7500 publications of agent-based and individual based models with additional detailed metadata on availability of code and bibliometric information on the landscape of ABM/IBM publications that we welcome you to explore.
Displaying 10 of 919 results for "P Van Geert" clear search
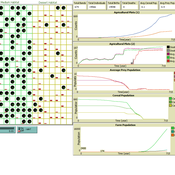
Foragers to Farmers
Nick Gauthier Elske van der Vaart Michael Storozum Tim Dorscheidt | Published Monday, July 22, 2024This model is represents an effort to replicate one of the first attempts (van der Vaart 2006) to develop an agent based model of agricultural origins using principles and equations drawn from human behavioral ecology. We have taken one theory of habitat choice (Ideal Free Distribution) and applied it to human behavioral adaptations to differences in resource quality of different habitats.
Exploring social psychology theory for modelling farmer decision-making
James Millington | Published Tuesday, September 18, 2012 | Last modified Saturday, April 27, 2013To investigate the potential of using Social Psychology Theory in ABMs of natural resource use and show proof of concept, we present an exemplary agent-based modelling framework that explicitly represents multiple and hierarchical agent self-concepts
Peer reviewed Modelling value change; An exploratory approach
Tristan de Wildt Ibo van de Poel | Published Tuesday, June 20, 2023 | Last modified Tuesday, December 12, 2023This model has been developed together with the publication ‘Modelling Value Change - An Exploratory Approach’
Value change and moral change have increasingly become topics of interest in the philosophical literature. Several theoretical accounts have been proposed. Such accounts are usually based on certain theoretical and conceptual assumptions and their strengths and weaknesses are often hard to determine and compare, also because they are based on limited empirical evidence.
We propose that a step forward can be made with the help of agent-based modelling (ABM). ABM can be used to investigate whether a simulation model based on a specific account of value change can reproduce relevant phenomena. To illustrate this approach, we built a model based on the pragmatist account of value change proposed in van de Poel and Kudina (2022). We show that this model can reproduce four relevant phenomena, namely 1) the inevitability and stability of values, 2) how different societies may react differently to external shocks, 3) moral revolutions, and 4) lock-in.
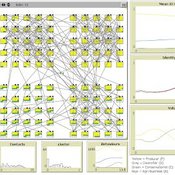
Peer reviewed ABM to create populations with realistic Big Five Personality Trait Expressions
Michael Vogrin | Published Tuesday, May 30, 2023This model aims at creating agent populations that have “personalities”, as described by the Big Five Model of Personality. The expression of the Big Five in the agent population has the following properties, so that they resemble real life populations as closely as possible:
-The population mean of each trait is 0.5 on a scale from 0 to 1.
-The population-wide distribution of each trait approximates a normal distribution.
-The intercorrelations of the Big Five are close to those observed in the Literature.
The literature used to fit the model was a publication by Dimitri van der Linden, Jan te Nijenhuis, and Arnold B. Bakker:
…
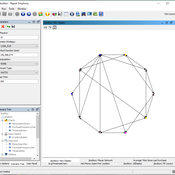
Peer reviewed Organizational behavior in the hierarchy model
Smarzhevskiy Ivan | Published Tuesday, June 18, 2019 | Last modified Wednesday, July 31, 2019In a two-level hierarchical structure (consisting of the positions of managers and operators), persons holding these positions have a certain performance and the value of their own (personal perception in this, simplified, version of the model) perception of each other. The value of the perception of each other by agents is defined as a random variable that has a normal distribution (distribution parameters are set by the control elements of the interface).
In the world of the model, which is the space of perceptions, agents implement two strategies: rapprochement with agents that perceive positively and distance from agents that perceive negatively (both can be implemented, one of these strategies, or neither, the other strategy, which makes the agent stationary). Strategies are implemented in relation to those agents that are in the radius of perception (PerRadius).
The manager (Head) forms a team of agents. The performance of the group (the sum of the individual productivities of subordinates, weighted by the distance from the leader) varies depending on the position of the agents in space and the values of their individual productivities. Individual productivities, in the current version of the model, are set as a random variable distributed evenly on a numerical segment from 0 to 100. The manager forms the team 1) from agents that are in (organizational) radius (Op_Radius), 2) among agents that the manager perceives positively and / or negatively (both can be implemented, one of the specified rules, or neither, which means the refusal of the command formation).
Agents can (with a certain probability, given by the variable PrbltyOfDecisn%), in case of a negative perception of the manager, leave his group permanently.
It is possible in the model to change on the fly radii values, update the perception value across the entire population and the perception of an individual agent by its neighbors within the perception radius, and the probability values for a subordinate to make a decision about leaving the group.
You can also change the set of strategies for moving agents and strategies for recruiting a team manager. It is possible to add a randomness factor to the movement of agents (Stoch_Motion_Speed, the default is set to 0, that is, there are no random movements).
…
We propose here a computational model of school segregation that is aligned with a corresponding Schelling-type model of residential segregation. To adapt the model for application to school segregation, we move beyond previous work by combining two preference arguments in modeling parents’ school choice, preferences for the ethnic composition of a school and preferences for minimizing the travelling distance to the school.
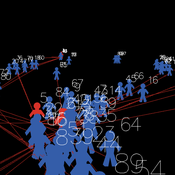
JLootBox: An Agent-Based Model of Social Influence and Gambling in Online Video Games
Lila Zayed | Published Friday, May 06, 2022This model aims to explore how gambling-like behavior can emerge in loot box spending within gaming communities. A loot box is a purchasable mystery box that randomly awards the player a series of in-game items. Since the contents of the box are largely up to chance, many players can fall into a compulsion loop of purchasing, as the fear of missing out and belief in the gambler’s fallacy allow one to rationalize repeated purchases, especially when one compares their own luck to others. To simulate this behavior, this model generates players in different network structures to observe how factors such as network connectivity, a player’s internal decision making strategy, or even common manipulations games use these days may influence a player’s transactions.
PA/C model with affinity
N. Leticia Abrica-Jacinto Evguenii Kurmyshev Héctor Juárez | Published Thursday, October 27, 2016We expose RA agent-based model of the opinion and tolerance dynamics in artificial societies. The formal mathematical model is based on the ideas of Social Influence, Social Judgment, and Social Identity theories.
Addressing Barriers to Primary Care Access for Latinos in the U.S.: An Agent-Based Model
S.R. Aurora (a.k.a. Mai P. Trinh) Hyunsung Oh | Published Tuesday, August 16, 2022Disparities in access to primary health care have led to health disadvantages among Latinos and other non-White racial groups. To better identify and understand which policies are most likely to improve health care for Latinos, we examined differences in access to primary care between Latinos with proficient English language skills and Latinos with limited English proficiency (LEP) and estimated the extent of access to primary care providers (PCPs) among Latinos in the U.S.
A Model of the Gender Cliff in the Relative Contribution to the Household Income
André Grow Jan Van Bavel | Published Wednesday, December 18, 2019In Western countries, the distribution of relative incomes within marriages tends to be skewed in a remarkable way. Husbands usually do not only earn more than their female partners, but there also is a striking discontinuity in their relative contributions to the household income at the 50/50 point: many wives contribute just a bit less than or as much as their husbands, but few contribute more. Our model makes it possible to study a social mechanism that might create this ‘cliff’: women and men differ in their incomes (even outside marriage) and this may differentially affect their abilities to find similar- or higher-income partners. This may ultimately contribute to inequalities within the households that form. The model and associated files make it possible to assess the merit of this mechanism in 27 European countries.
Displaying 10 of 919 results for "P Van Geert" clear search