About the CoMSES Model Library more info
Our mission is to help computational modelers at all levels engage in the establishment and adoption of community standards and good practices for developing and sharing computational models. Model authors can freely publish their model source code in the Computational Model Library alongside narrative documentation, open science metadata, and other emerging open science norms that facilitate software citation, reproducibility, interoperability, and reuse. Model authors can also request peer review of their computational models to receive a DOI.
All users of models published in the library must cite model authors when they use and benefit from their code.
Please check out our model publishing tutorial and contact us if you have any questions or concerns about publishing your model(s) in the Computational Model Library.
We also maintain a curated database of over 7500 publications of agent-based and individual based models with additional detailed metadata on availability of code and bibliometric information on the landscape of ABM/IBM publications that we welcome you to explore.
Displaying 10 of 160 results for 'Ian M Hamilton'
TERRoir level Organic matter Interactions and Recycling model
Myriam Grillot | Published Wednesday, April 19, 2017 | Last modified Wednesday, June 17, 2020The TERROIR agent-based model was built for the multi-level analysis of biomass and nutrient flows within agro-sylvo-pastoral villages in West Africa. It explicitly takes into account both human organization and spatial extension of such flows.
FlowLogo for a real case study
Vahid Aghaie | Published Monday, May 18, 2020Juan Castilla-Rho et al. (2015) developed a platform, named FLowLogo, which integrates a 2D, finite-difference solution of the governing equations of groundwater flow with agent-based simulation. We used this model for Rafsanjan Aquifer, which is located in an arid region in Iran. To use FLowLogo for a real case study, one needs to add GIS shapefiles of boundary conditions and modify the code written in NetLogo a little bit. The FlowLogo model used in our research is presented here.
Peer reviewed General Housing Model
J Applegate | Published Thursday, May 07, 2020The General Housing Model demonstrates a basic housing market with bank lending, renters, owners and landlords. This model was developed as a base to which students contributed additional functions during Arizona State University’s 2020 Winter School: Agent-Based Modeling of Social-Ecological Systems.
Do microfinance institutes help slum-dwellers in coping with frequent disasters? An Agent-Based Modelling study
Mitali Yeshwant Joshi | Published Friday, March 13, 2020The model aims to investigate the role of Microfinance Institutes (MFIs) in strengthening the coping capacity of slum-dwellers (residents) in case of frequent disasters. The main purpose of the model is system understanding. It aids in understanding the following research question: Are the microcredits provided by MFI to start a small business helpful in increasing coping capacity of a slum dweller for recovering from frequent and intense disasters?
Peer reviewed Neighbor Influenced Energy Retrofit (NIER) agent-based model
Eric Boria | Published Friday, April 03, 2020The NIER model is intended to add qualitative variables of building owner types and peer group scales to existing energy efficiency retrofit adoption models. The model was developed through a combined methodology with qualitative research, which included interviews with key stakeholders in Cleveland, Ohio and Detroit and Grand Rapids, Michigan. The concepts that the NIER model adds to traditional economic feasibility studies of energy retrofit decision-making are differences in building owner types (reflecting strategies for managing buildings) and peer group scale (neighborhoods of various sizes and large-scale Districts). Insights from the NIER model include: large peer group comparisons can quickly raise the average energy efficiency values of Leader and Conformist building owner types, but leave Stigma-avoider owner types as unmotivated to retrofit; policy interventions such as upgrading buildings to energy-related codes at the point of sale can motivate retrofits among the lowest efficient buildings, which are predominantly represented by the Stigma-avoider type of owner; small neighborhood peer groups can successfully amplify normal retrofit incentives.
Artificial Long House Valley-Black Mesa
Amy Warren Lisa Sattenspiel | Published Thursday, March 19, 2020This model is an extension of the Artificial Long House Valley (ALHV) model developed by the authors (Swedlund et al. 2016; Warren and Sattenspiel 2020). The ALHV model simulates the population dynamics of individuals within the Long House Valley of Arizona from AD 800 to 1350. Individuals are aggregated into households that participate in annual agricultural and demographic cycles. The present version of the model incorporates features of the ALHV model including realistic age-specific fertility and mortality and, in addition, it adds the Black Mesa environment and population, as well as additional methods to allow migration between the two regions.
As is the case for previous versions of the ALHV model as well as the Artificial Anasazi (AA) model from which the ALHV model was derived (Axtell et al. 2002; Janssen 2009), this version makes use of detailed archaeological and paleoenvironmental data from the Long House Valley and the adjacent areas in Arizona. It also uses the same methods as the original AA model to estimate annual maize productivity of various agricultural zones within the Long House Valley. A new environment and associated methods have been developed for Black Mesa. Productivity estimates from both regions are used to determine suitable locations for households and farms during each year of the simulation.
This model extends the original Artifical Anasazi (AA) model to include individual agents, who vary in age and sex, and are aggregated into households. This allows more realistic simulations of population dynamics within the Long House Valley of Arizona from AD 800 to 1350 than are possible in the original model. The parts of this model that are directly derived from the AA model are based on Janssen’s 1999 Netlogo implementation of the model; the code for all extensions and adaptations in the model described here (the Artificial Long House Valley (ALHV) model) have been written by the authors. The AA model included only ideal and homogeneous “individuals” who do not participate in the population processes (e.g., birth and death)–these processes were assumed to act on entire households only. The ALHV model incorporates actual individual agents and all demographic processes affect these individuals. Individuals are aggregated into households that participate in annual agricultural and demographic cycles. Thus, the ALHV model is a combination of individual processes (birth and death) and household-level processes (e.g., finding suitable agriculture plots).
As is the case for the AA model, the ALHV model makes use of detailed archaeological and paleoenvironmental data from the Long House Valley and the adjacent areas in Arizona. It also uses the same methods as the original model (from Janssen’s Netlogo implementation) to estimate annual maize productivity of various agricultural zones within the valley. These estimates are used to determine suitable locations for households and farms during each year of the simulation.
Geographic Expansion Model (GEM)
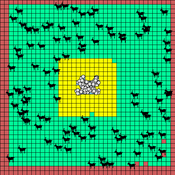
Sean Bergin | Published Friday, February 28, 2020The purpose of this model is to explore the importance of geographic factors to the settlement choices of early Neolithic agriculturalists. In the model, each agriculturalist spreads to one of the best locations within a modeler specified radius. The best location is determined by choosing either one factor such as elevation or slope; or by ranking geographic factors in order of importance.
Socio-hydrologicalModel_version_SESMO
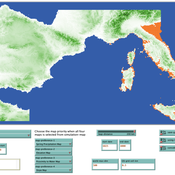
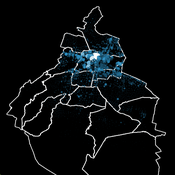
Andres Baeza-Castro Luis Bojorquez Marco Janssen Hallie Eakin Fidel Serrano-Candela Paola Gomez Yosune Miquelajauregui Rodrigo Garcia-Herrera | Published Tuesday, February 05, 2019We present here MEGADAPT_SESMO model. A hybrid, dynamic, spatially explicit, integrated model to simulate the vulnerability of urban coupled socio-ecological systems – in our case, the vulnerability of Mexico City to socio-hydrological risk.
A Bottom-Up Simulation on Competition and Displacement of Online Interpersonal Communication Platforms
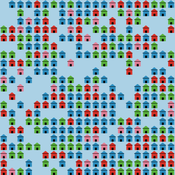
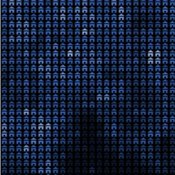
great-sage-futao | Published Tuesday, December 31, 2019 | Last modified Tuesday, December 31, 2019This model aims to simulate Competition and Displacement of Online Interpersonal Communication Platforms process from a bottom-up angle. Individual interpersonal communication platform adoption and abandonment serve as the micro-foundation of the simulation model. The evolution mode of platform user online communication network determines how present platform users adjust their communication relationships as well as how new users join that network. This evolution mode together with innovations proposed by individual interpersonal communication platforms would also have impacts on the platform competition and displacement process and result by influencing individual platform adoption and abandonment behaviors. Three scenes were designed to simulate some common competition situations occurred in the past and current time, that two homogeneous interpersonal communication platforms competed with each other when this kind of platforms first came into the public eye, that a late entrant platform with a major innovation competed with the leading incumbent platform during the following days, as well as that both the leading incumbent and the late entrant continued to propose many small innovations to compete in recent days, respectively.
Initial parameters are as follows: n(Nmax in the paper), denotes the final node number of the online communication network node. mi (m in the paper), denotes the initial degree of those initial network nodes and new added nodes. pc(Pc in the paper), denotes the proportion of links to be removed and added in each epoch. pst(Pv in the paper), denotes the proportion of nodes with a viscosity to some platforms. comeintime(Ti in the paper), denotes the epoch when Platform 2 joins the market. pit(Pi in the paper), denotes the proportion of nodes adopting Platform 2 immediately at epoch comeintime(Ti). ct(Ct in the paper), denotes the Innovation Effective Period length. In Scene 2, There is only one major platform proposed by Platform 2, and ct describes that length. However, in Scene 3, Platform 2 and 1 will propose innovations alternately. And so, we set ct=10000 in simulation program, and every jtt epochs, we alter the innovation proposer from one platform to the other. Hence in this scene, jtt actually denotes the Innovation Effective Period length instead of ct.
Displaying 10 of 160 results for 'Ian M Hamilton'