About the CoMSES Model Library more info
Our mission is to help computational modelers at all levels engage in the establishment and adoption of community standards and good practices for developing and sharing computational models. Model authors can freely publish their model source code in the Computational Model Library alongside narrative documentation, open science metadata, and other emerging open science norms that facilitate software citation, reproducibility, interoperability, and reuse. Model authors can also request peer review of their computational models to receive a DOI.
All users of models published in the library must cite model authors when they use and benefit from their code.
Please check out our model publishing tutorial and contact us if you have any questions or concerns about publishing your model(s) in the Computational Model Library.
We also maintain a curated database of over 7500 publications of agent-based and individual based models with additional detailed metadata on availability of code and bibliometric information on the landscape of ABM/IBM publications that we welcome you to explore.
Displaying 10 of 219 results for "Martin Dribe" clear search
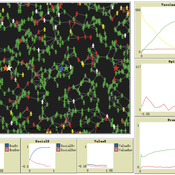
Multi-agent model of the spread of climate change denial
Kalina Maria Piskorska Martin Takáč | Published Monday, March 03, 2025This NetLogo model simulates the spread of climate change beliefs within a population of individuals. Each believer has an initial belief level, which changes over time due to interactions with other individuals and exposure to media. The aim of the model is to identify possible methods for reducing climate change denial.
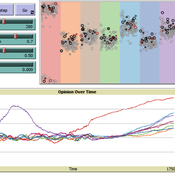
How Availability Heuristic, Confirmation Bias and Fear May Drive Societal Polarisation: An Opinion Dynamics Simulation of the Case of COVID-19 Vaccination
Teng Li | Published Friday, December 22, 2023This model simulates the opinion dynamics of COVID-19 vaccination to examine especially how fears and cognitive bias contribute to the opinion polarisation and vaccination rate. In studying the opinion dynamics of COVID-19 vaccination, this model refers to the HUMAT framework (Antosz et al, 2019). Many psychological and social processes are included in the model, such as dynamical decision-making processes of information exchange and fear formation, satisfaction evaluation, preferred decision selection and dissonance reduction.
Social Innovation Model
Jiin Jung | Published Monday, April 28, 2025This research aims to uncover the micro-mechanisms that drive the macro-level relationship between cultural tolerance and innovation. We focus on the indirect influence of minorities—specifically, workers with diverse domain expertise—within collaboration networks. We propose that minority influence from individuals with different expertise can serve as a key driver of organizational innovation, particularly in dynamic market environments, and that cultural tolerance is critical for enabling such minority-induced innovation. Our model demonstrates that seemingly conflicting empirical patterns between cultural tightness/looseness and innovation can emerge from the same underlying micro-mechanisms, depending on parameter values. A systematic simulation experiment revealed an optimal cultural configuration: a medium level of tolerance (t = 0.6) combined with low consistency (κ = 0.05) produced the fastest adaptation to abrupt market changes. These findings provide evidence that indirect minority influence is a core micro-mechanism linking cultural tolerance to innovation.
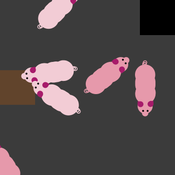
A model on feeding and social interaction behaviour of pigs
Iris J.M.M. Boumans | Published Thursday, May 04, 2017 | Last modified Tuesday, February 27, 2018The model simulates interaction between internal physiological factors (e.g. energy balance) and external social factors (e.g. competition level) underlying feeding and social interaction behaviour of commercially group-housed pigs.
Soy2Grow-ABM-V1
Siavash Farahbakhsh | Published Monday, January 20, 2025The Soy2Grow ABM aims to simulate the adoption of soybean production in Flanders, Belgium. The model primarily considers two types of agents as farmers: 1) arable and 2) dairy farmers. Each farmer, based on its type, assesses the feasibility of adopting soybean cultivation. The feasibility assessment depends on many interrelated factors, including price, production costs, yield, disease, drought (i.e., environmental stress), social pressure, group formations, learning and skills, risk-taking, subsidies, target profit margins, tolerance to bad experiences, etc. Moreover, after adopting soybean production, agents will reassess their performance. If their performance is unsatisfactory, an agent may opt out of soy production. Therefore, one of the main outcomes to look for in the model is the number of adopters over time.
The main agents are farmers. Generally, factors influencing farmers’ decision-making are divided into seven main areas: 1) external environmental factors, 2) cooperation and learning (with slight differences depending on whether they are arable or dairy farmers), 3) crop-specific factors, 4) economics, 5) support frameworks, 6) behavioral factors, and 7) the role of mobile toasters (applicable only to dairy farmers).
Moreover, factors not only influence decision-making but also interact with each other. Specifically, external environmental factors (i.e., stress) will result in lower yield and quality (protein content). The reducing effect, identified during participatory workshops, can reach 50 %. Skills can grow and improve yield; however, their growth has a limit and follows different learning curves depending on how individualistic a farmer is. During participatory workshops, it was identified that, contrary to cooperative farmers, individualistic farmers may learn faster and reach their limits more quickly. Furthermore, subsidies directly affect revenues and profit margins; however, their impact may disappear when they are removed. In the case of dairy farmers, mobile toasters play an important role, adding toasting and processing costs to those producing soy for their animal feed consumption.
Last but not least, behavioral factors directly influence the final adoption decision. For example, high risk-taking farmers may adopt faster, whereas more conservative farmers may wait for their neighbors to adopt first. Farmers may evaluate their success based on their own targets and may also consider other crops rather than soy.
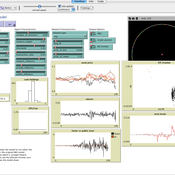
Multi Asset Variable Network Stock Market Model
Matthew Oldham | Published Monday, September 12, 2016 | Last modified Tuesday, October 10, 2017An artifcal stock market model that allows users to vary the number of risky assets as well as the network topology that investors forms in an attempt to understand the dynamics of the market.
Peer reviewed ACross (Academic Collaboration, Research, Output, and System Simulation)
Wenhan Feng Bayi Li | Published Saturday, June 28, 2025The primary purpose of this model is to explain the dynamic processes within university-centered collaboration networks, with a particular focus on the complex transformation of academic knowledge into practical projects. Based on investigations of actual research projects and a thorough literature review, the model integrates multiple drivers and influencing factors to explore how these factors affect the formation and evolution of collaboration networks under different parameter scenarios. The model places special emphasis on the impact of disciplinary attributes, knowledge exchange, and interdisciplinary collaboration on the dynamics of collaboration networks, as well as the complex mechanisms of network structure, system efficiency, and interdisciplinary interactions during project formation.
Specifically, the model aims to:
- Simulate how university research departments drive the formation of research projects through knowledge creation.
- Investigate how the dynamics of collaboration networks influence the transformation of innovative hypotheses into matured projects.
- Examine the critical roles of knowledge exchange and interdisciplinary collaboration in knowledge production and project formation.
- Provide both quantitative and qualitative insights into the interactions among academia, industry, and project outputs.
Viability analysis of a population submitted to floods
Sophie Martin | Published Wednesday, September 22, 2021This model computes the guaranteed viability kernel of a model describing the evolution of a population submitted to successive floods.
The population is described by its wealth and its adaptation rate to floods, the control are information campaigns that have a cost but increase the adaptation rate and the expected successive floods belong to given set defined by the maximal high and the minimal time between two floods.
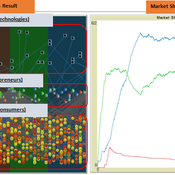
The simulation on the study of the optimal business strategy with the interaction between technologies and consumers.
sej-yoo | Published Monday, June 27, 2022 | Last modified Monday, July 04, 2022HOW IT WORKS
This model consists of three agents, and each agent type operates per business theories as below.
a. New technologies(Tech): It evolves per sustaining or disruptive technology trajectory with the constraint of project management triangle (Scope, Time, Quality, and Cost).
b. Entrepreneurs(Entre): It builds up the solution by combining Tech components per its own strategy (Exploration, Exploitation, or Ambidex).
c. Consumer(Consumer): It selects the solution per its own preference due to Diffusion of innovation theory (Innovators, Early Adopters, Early Majority, Late Majority, Laggards)
…
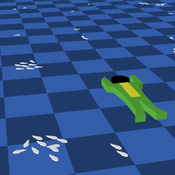
Peer reviewed FishCensus
Miguel Pais | Published Tuesday, December 06, 2016 | Last modified Thursday, February 09, 2017The FishCensus model simulates underwater visual census methods, where a diver estimates the abundance of fish. A separate model is used to shape species behaviours and save them to a file that can be shared and used by the counting model.
Displaying 10 of 219 results for "Martin Dribe" clear search