Our mission is to help computational modelers develop, document, and share their computational models in accordance with community standards and good open science and software engineering practices. Model authors can publish their model source code in the Computational Model Library with narrative documentation as well as metadata that supports open science and emerging norms that facilitate software citation, computational reproducibility / frictionless reuse, and interoperability. Model authors can also request private peer review of their computational models. Models that pass peer review receive a DOI once published.
All users of models published in the library must cite model authors when they use and benefit from their code.
Please check out our model publishing tutorial and feel free to contact us if you have any questions or concerns about publishing your model(s) in the Computational Model Library.
Displaying 10 of 59 results income clear search
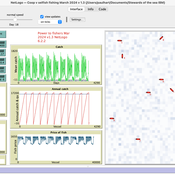
Peer reviewed An IBM of a fishing fleet exploiting a pelagic resource and with a fisher management system. A preliminary version.
Paul Hart | Published Tuesday, March 19, 2024A fisher directed management system was describeded by Hart (2021). It was proposed that fishers should only be allowed to exploit a resource if they collaborated in a resource management system for which they would own and be collectively responsible for. As part of the system fishers would need to follow the rules of exploitation set by the group and provide a central unit with data with which to monitor the fishery. Any fisher not following the rules would at first be fined but eventually expelled from the fishery if he/she continued to act selfishly. This version of the model establishes the dynamics of a fleet of vessels and controls overfishing by imposing fines on fishers whose income is low and who are tempted to keep fishing beyond the set quota which is established each year depending on the abundance of the fish stock. This version will later be elaborated to have interactions between the fishers including pressure to comply with the norms set by the group and which could lead to a stable management system.
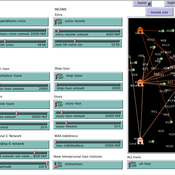
Agent-based tax evasion model for investigating impacts of public disclosure
Hiroyuki Sano | Published Thursday, March 14, 2024The model explores the impact of public disclosure on tax compliance among diverse agents, including individual taxpayers and a tax authority. It incorporates heterogeneous preferences and income endowments among taxpayers, captured through a utility function that considers psychic costs subtracted from expected pecuniary utility. These costs include moral, reciprocity, and stigma costs associated with norm violations, leading to variations in taxpayers’ risk attitudes and related parameters. The tax authority’s attributes, such as the frequency of random audits, penalty rate, and the choice between partial or full disclosure, remain fixed throughout the simulation. Income endowments and preference parameters are randomly assigned to taxpayers at the outset.
Taxpayers maximize their expected utility by reporting income, taking into account tax, penalty, and audit rates. They make annual decisions based on their own and their peers’ behaviors from the previous year. Taxpayers indirectly interact at the societal level through public disclosure conducted by the tax authority, exchanging tax information among peers. Each period in the simulation collects data on total reported income, average compliance rates per income group, distribution of compliance rates, counts of compliers, full evaders, partial evaders, and the numbers of taxpayers experiencing guilt and anger. The model evaluates whether public disclosure positively or negatively impacts compliance rates and quantifies this impact based on aggregated individual reporting behaviors.
Peer reviewed Credit and debt market of low-income families
Márton Gosztonyi | Published Tuesday, December 12, 2023 | Last modified Friday, January 19, 2024The purpose of the Credit and debt market of low-income families model is to help the user examine how the financial market of low-income families works.
The model is calibrated based on real-time data which was collected in a small disadvantaged village in Hungary it contains 159 households’ social network and attributes data.
The simulation models the households’ money liquidity, expenses and revenue structures as well as the formal and informal loan institutions based on their network connections. The model forms an intertwined system integrated in the families’ local socioeconomic context through which families handle financial crises and overcome their livelihood challenges from one month to another.
The simulation-based on the abstract model of low-income families’ financial survival system at the bottom of the pyramid, which was described in following the papers:
…
DARTS: an agent-based model of the global food system for studying its resilience to shocks
Hubert Fonteijn | Published Wednesday, November 22, 2023DARTS simulates food systems in which agents produce, consume and trade food. Here, food is a summary item that roughly corresponds to commodity food types (e.g. rice). No other food types are taken into account. Each food system (World) consists of its own distribution of agents, regions and connections between agents. Agents differ in their ability to produce food, earn off-farm income and trade food. The agents aim to satisfy their food requirements (which are fixed and equal across agents) by either their own food production or by food purchases. Each simulation step represents one month, in which agents can produce (if they have productive capacity and it is a harvest month for their region), earn off-farm income, trade food (both buy and sell) and consume food. We evaluate the performance of the food system by averaging the agents’ food satisfaction, which is defined as the ratio of the food consumed by each agent at the end of each month divided by her food requirement. At each step, any of the abovementioned attributes related to the agents’ ability to satisfy their food requirement can (temporarily) be shocked. These shocks include reducing the amount of food they produce, removing their ability to trade locally or internationally and reducing their cash savings. Food satisfaction is quantified (both immediately after the shock and in the year following the shock) to evaluate food security of a particular food system, both at the level of agent types (e.g. the urban poor and the rural poor) and at the systems level. Thus, the effects of shocks on food security can be related to the food system’s structure.
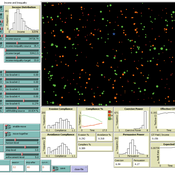
The Targeted Subsidies Plan Model
Hassan Bashiri | Published Thursday, September 21, 2023The targeted subsidies plan model is based on the economic concept of targeted subsidies.
The targeted subsidies plan model simulates the distribution of subsidies among households in a community over several years. The model assumes that the government allocates a fixed amount of money each year for the purpose of distributing cash subsidies to eligible households. The eligible households are identified by dividing families into 10 groups based on their income, property, and wealth. The subsidy is distributed to the first four groups, with the first group receiving the highest subsidy amount. The model simulates the impact of the subsidy distribution process on the income and property of households in the community over time.
The model simulates a community of 230 households, each with a household income and wealth that follows a power-law distribution. The number of household members is modeled by a normal distribution. The model allocates a fixed amount of money each year for the purpose of distributing cash subsidies among eligible households. The eligible households are identified by dividing families into 10 groups based on their income, property, and wealth. The subsidy is distributed to the first four groups, with the first group receiving the highest subsidy amount.
The model runs for a period of 10 years, with the subsidy distribution process occurring every month. The subsidy received by each household is assumed to be spent, and a small portion may be saved and added to the household’s property. At the end of each year, the grouping of households based on income and assets is redone, and a number of families may be moved from one group to another based on changes in their income and property.
…
Agent-Based Simulation for International Tax Compliance
Peter Gerbrands | Published Tuesday, July 18, 2023Country-by-Country Reporting and Automatic Exchange of Information have recently been implemented in European Union (EU) countries. These international tax reforms increase tax compliance in the short term. In the long run, however, taxpayers will continue looking abroad to avoid taxation and, countries, looking for additional revenues, will provide opportunities. As a result, tax competition intensifies and the initial increase in compliance could reverse. To avoid international tax reforms being counteracted by tax competition, this paper suggests bilateral responsive regulation to maximize compliance. This implies that countries would use different tax policy instruments toward other countries, including tax and secrecy havens.
To assess the effectiveness of fully or partially enforce tax policies, this agent based model has been ran many times under different enforcement rules, which influence the perceived enforced- and voluntary compliance, as the slippery-slope model prescribes. Based on the dynamics of this perception and the extent to which agents influence each other, the annual amounts of tax evasion, tax avoidance and taxes paid are calculated over longer periods of time.
The agent-based simulation finds that a differentiated policy response could increase tax compliance by 6.54 percent, which translates into an annual increase of €105 billion in EU tax revenues on income, profits, and capital gains. Corporate income tax revenues in France, Spain, and the UK alone would already account for €35 billion.
Schelling Model of the City of Salzburg
Andreas Schlagbauer | Published Monday, December 05, 2022The purpose of the model is to better understand, how different factors for human residential choices affect the city’s segregation pattern. Therefore, a Schelling (1971) model was extended to include ethnicity, income, and affordability and applied to the city of Salzburg. So far, only a few studies have tried to explore the effect of multiple factors on the residential pattern (Sahasranaman & Jensen, 2016, 2018; Yin, 2009). Thereby, models using multiple factors can produce more realistic results (Benenson et al., 2002). This model and the corresponding thesis aim to fill that gap.
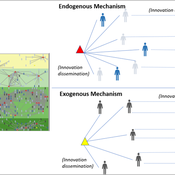
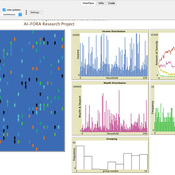
Peer reviewed Modelling Agricultural Innovations as a Social-Ecological Phenomenon
Maja Schlüter Udita Sanga | Published Thursday, November 17, 2022The goal of the AG-Innovation agent-based model is to explore and compare the effects of two alternative mechanisms of innovation development and diffusion (exogenous, linear and endogenous, non-linear) on emergent properties of food and income distribution and adoption rates of different innovations. The model also assesses the range of conditions under which these two alternative mechanisms would be effective in improving food security and income inequality outcomes. Our modelling questions were: i) How do cross-scalar social-ecological interactions within agricultural innovation systems affect system outcomes of food security and income inequality? ii) Do foreign aid-driven exogenous innovation perpetuate income inequality and food insecurity and if so, under which conditions? iii) Do community-driven endogenous innovations improve food security and income inequality and if so, under which conditions? The Ag-Innovation model is intended to serve as a thinking tool for for the development and testing of hypotheses, generating an understanding of the behavior of agricultural innovation systems, and identifying conditions under which alternated innovation mechanisms would improve food security and income inequality outcomes.
Peer reviewed Modern Wage Dynamics
J M Applegate | Published Sunday, June 05, 2022The Modern Wage Dynamics Model is a generative model of coupled economic production and allocation systems. Each simulation describes a series of interactions between a single aggregate firm and a set of households through both labour and goods markets. The firm produces a representative consumption good using labour provided by the households, who in turn purchase these goods as desired using wages earned, thus the coupling.
Each model iteration the firm decides wage, price and labour hours requested. Given price and wage, households decide hours worked based on their utility function for leisure and consumption. A labour market construct chooses the minimum of hours required and aggregate hours supplied. The firm then uses these inputs to produce goods. Given the hours actually worked, the households decide actual consumption and a market chooses the minimum of goods supplied and aggregate demand. The firm uses information gained through observing market transactions about consumption demand to refine their conceptions of the population’s demand.
The purpose of this model is to explore the general behaviour of an economy with coupled production and allocation systems, as well as to explore the effects of various policies on wage and production, such as minimum wage, tax credits, unemployment benefits, and universal income.
…
Physical activity promotion and the United Nations Sustainable Development Goals
Leandro Garcia Ivana Stankov Rahul Goel | Published Tuesday, March 01, 2022This model was created to investigate the potential impacts of large-scale recreational and transport-related physical activity promotion strategies on six United Nations Sustainable Development Goals (SDGs) related outcomes—road traffic deaths (SDG 3), transportation mode share (SDG 9), convenient access to public transport, levels of fine particulate matter, and access to public open spaces (SDG 11), and levels of carbon dioxide emissions (SDG 13)—in three cities designed as abstract representations of common city types in high-, middle-, and low-income countries.
Displaying 10 of 59 results income clear search