Our mission is to help computational modelers develop, document, and share their computational models in accordance with community standards and good open science and software engineering practices. Model authors can publish their model source code in the Computational Model Library with narrative documentation as well as metadata that supports open science and emerging norms that facilitate software citation, computational reproducibility / frictionless reuse, and interoperability. Model authors can also request private peer review of their computational models. Models that pass peer review receive a DOI once published.
All users of models published in the library must cite model authors when they use and benefit from their code.
Please check out our model publishing tutorial and feel free to contact us if you have any questions or concerns about publishing your model(s) in the Computational Model Library.
Displaying 10 of 159 results for "Erle C Ellis" clear search
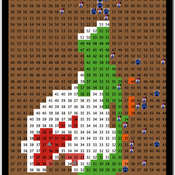
MCA-SdA (ABM of mining-community-aquifer interactions in Salar de Atacama, Chile)
Wenjuan Liu | Published Tuesday, December 01, 2020 | Last modified Thursday, November 04, 2021This model represnts an unique human-aquifer interactions model for the Li-extraction in Salar de Atacama, Chile. It describes the local actors’ experience of mining-induced changes in the socio-ecological system, especially on groundwater changes and social stressors. Social interactions are designed specifically according to a long-term local fieldwork by Babidge et al. (2019, 2020). The groundwater system builds on the FlowLogo model by Castilla-Rho et al. (2015), which was then parameterized and calibrated with local hydrogeological inputs in Salar de Atacama, Chile. The social system of the ABM is defined and customozied based on empirical studies to reflect three major stressors: drought stress, population stress, and mining stress. The model reports evolution of groundwater changes and associated social stress dynamics within the modeled time frame.
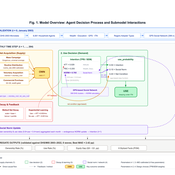
Peer reviewed Kenya ITN Agent-Based Microsimulation (2003–2024)
Wooyoung Kim Hosang Shin | Published Saturday, April 18, 2026 | Last modified Tuesday, June 16, 2026An agent-based microsimulation of insecticide-treated net (ITN) distribution and adoption in Kenya (2003–2024), integrating the Theory of Planned Behaviour, Rogers diffusion, Weibull net decay, and a GPS-based two-layer social network. 8,561 household agents calibrated via Approximate Bayesian Computation to six DHS/MIS survey waves, achieving 2.42 pp mean absolute error on Kenya-level ownership. The analysis chain supports mechanism counterfactuals and policy experiments on equity outcomes of ITN distribution strategies.
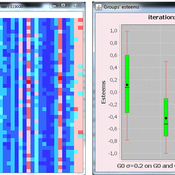
Gender differentiation model
Sylvie Huet | Published Monday, April 20, 2020 | Last modified Thursday, April 23, 2020This is a gender differentiation model in terms of reputations, prestige and self-esteem (presented in the paper https://journals.plos.org/plosone/article?id=10.1371/journal.pone.0236840). The model is based on the influence function of the Leviathan model (Deffuant, Carletti, Huet 2013 and Huet and Deffuant 2017) considering two groups.
This agent-based model studies how inequalities can be explained by the difference of open-mindness between two groups of interacting agents. We consider agents having an opinion/esteem about each other and about themselves. During dyadic meetings, agents change their respective opinion about each other and possibly about other agents they gossip about, with a noisy perception of the opinions of their interlocutor. Highly valued agents are more influential in such encounters. We study an heterogeneous population of two different groups: one more open to influence of others, taking less into account their perceived difference of esteem, called L; a second one less prone to it, called S, who designed the credibility they give to others strongly based on how higher or lower valued than themselves they perceive them.
We show that a mixed population always turns in favor to some agents belonging to the group of less open-minded agents S, and harms the other group: (1) the average group self-opinion or reputation of S is always better than the one of L; (2) the higher rank in terms of reputation are more frequently occupied by the S agents while the L agents occupy more the bottom rank; (3) the properties of the dynamics of differentiation between the two groups are similar to the properties of the glass ceiling effect proposed by Cotter et al (2001).
Peer reviewed Neighbor Influenced Energy Retrofit (NIER) agent-based model
Eric Boria | Published Friday, April 03, 2020The NIER model is intended to add qualitative variables of building owner types and peer group scales to existing energy efficiency retrofit adoption models. The model was developed through a combined methodology with qualitative research, which included interviews with key stakeholders in Cleveland, Ohio and Detroit and Grand Rapids, Michigan. The concepts that the NIER model adds to traditional economic feasibility studies of energy retrofit decision-making are differences in building owner types (reflecting strategies for managing buildings) and peer group scale (neighborhoods of various sizes and large-scale Districts). Insights from the NIER model include: large peer group comparisons can quickly raise the average energy efficiency values of Leader and Conformist building owner types, but leave Stigma-avoider owner types as unmotivated to retrofit; policy interventions such as upgrading buildings to energy-related codes at the point of sale can motivate retrofits among the lowest efficient buildings, which are predominantly represented by the Stigma-avoider type of owner; small neighborhood peer groups can successfully amplify normal retrofit incentives.
Peer reviewed Collective Problem-Solving Capacity, Trust, and O-Ring Team Productivity
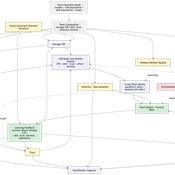
Taseer Salahuddin Hasan Vergil Muhammad Abdullah Yasser | Published Saturday, August 08, 2026This is a NetLogo 7.0.1 agent-based model of interdependent team productivity under O-ring production logic. The model asks when collective problem-solving capacity (CPS) improves team output and when its effect is constrained by trust, burnout, specialization diversity, weak-link quality, and team-formation rules. Agents are heterogeneous in skill, CPS, trust, burnout, effort, learning rate, openness, specialization, adaptability, and aspiration. Each tick forms temporary teams, computes individual contribution quality, combines contributions through a geometric O-ring production function with an explicit weakest-link term, records output and success, and updates agents through feedback, learning, trust change, burnout, recovery, and turnover. The paper follows the ODD protocol, reports exact implementation equations, and analyzes six BehaviorSpace experiments with 50 stochastic repetitions per condition. Scenario results show that CPS is beneficial but not sufficient: productivity is highest when CPS is combined with trust, low burnout, effective coordination, and a reliable weakest-link floor. Diversity yields only modest gains at low CPS but larger gains when CPS is high. Formation-mode results are especially informative because mixed CPS-skill formation maximizes total output, whereas random formation has the highest binary success rate, showing that output magnitude and threshold success can diverge. The study contributes a transparent computational mechanism linking collective intelligence with O-ring production and identifies boundary conditions under which high-CPS teams can still be limited by weak links and interdependence.
ABM for Underwater optical wireless communication in a water tank
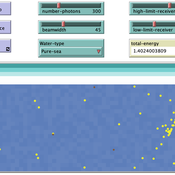
Mohamed ABID | Published Sunday, May 29, 2022This model simulates the propagation of photons in a water tank. A source of light emits an impulse of photons with equal energy represented by yellow dots. These photons are then scattered by water particles before possibly reaching the photo-detector represented by a gray line. Different types of water are considered. For each one of them we calculate the total received energy.
The water tank is represented by a blue rectangle with fixed dimensions. It’s exposed to the air interface and has totally absorbent barriers. Four types of water are supported. Each one is characterized by its absorption and scattering coefficients.
At the source, the photons are generated uniformly with a random direction within the beamwidth. Each photon travels a random distance drawn from a distribution depending on the water characteristics before encountering a water particle.
Based on the updated position of the photon, three situations may occur:
-The photon hits the barrier of the tank on its trajectory. In this case it’s considered as lost since the barriers are assumed totally absorbent.
…
Peer reviewed Avian pest control: Yield outcome due to insectivorous birds, falconry, and integration of nest boxes.
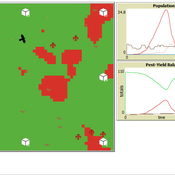
David Jung | Published Monday, November 13, 2023 | Last modified Sunday, November 19, 2023The model aims to simulate predator-prey relationships in an agricultural setting. The focus lies on avian communities and their effect on different pest organisms (here: pest birds, rodents, and arthropod pests). Since most case studies focused on the impact on arthropod pests (AP) alone, this model attempts to include effects on yield outcome. By incorporating three treatments with different factor levels (insectivorous bird species, falconry, nest box density) an experimental setup is given that allows for further statistical analysis to identify an optimal combination of the treatments.
In light of a global decline of birds, insects, and many other groups of organisms, alternative practices of pest management are heavily needed to reduce the input of pesticides. Avian pest control therefore poses an opportunity to bridge the disconnect between humans and nature by realizing ecosystem services and emphasizing sustainable social ecological systems.
Simulating Climate Stress and Social Instability: An Agent-Based Model of Ecosystem Degradation and Violence in Coastal Communities
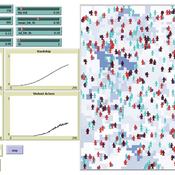
Jacopo A. Baggio hurtado-valdivieso | Published Sunday, April 12, 2026This model is an agent-based simulation designed to explore how climate-induced environmental degradation can contribute to the emergence of social violence in coastal communities that depend heavily on ecosystem services for their livelihoods. The model represents a coupled social–ecological system in which environmental shocks—such as sea level rise and marine ecosystem decline—affect local economic conditions, food security, and community stability.
Agents in the model represent individuals whose livelihoods depend on coastal ecosystems. Environmental degradation reduces ecosystem productivity and increases economic hardship, which can lead to the formation of grievances among agents. The model incorporates behavioral thresholds that determine how individuals respond to hardship and perceived injustice. Under certain conditions—particularly when institutional capacity and law enforcement effectiveness are limited—these grievances may escalate into violent behavior.
The simulation allows users to explore how different climate scenarios, levels of ecosystem degradation, livelihood dependence, and institutional responses influence the probability of social instability and violence. By modeling the interactions between environmental stress, socio-economic vulnerability, and governance capacity, the model provides a computational framework for examining potential pathways linking climate change and conflict in coastal social–ecological systems.
…
Schelling Model of the City of Salzburg
Andreas Schlagbauer | Published Monday, December 05, 2022The purpose of the model is to better understand, how different factors for human residential choices affect the city’s segregation pattern. Therefore, a Schelling (1971) model was extended to include ethnicity, income, and affordability and applied to the city of Salzburg. So far, only a few studies have tried to explore the effect of multiple factors on the residential pattern (Sahasranaman & Jensen, 2016, 2018; Yin, 2009). Thereby, models using multiple factors can produce more realistic results (Benenson et al., 2002). This model and the corresponding thesis aim to fill that gap.
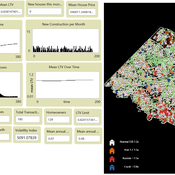
ZIP-Level Housing Supply Elasticity and Crash Dynamics: A GIS-Based Agent-Based Model of the Washington DC and Northern Virginia Metro Region
Mansoor Abdul Bari | Published Saturday, August 01, 2026 | Last modified Sunday, August 02, 2026This model tests whether local housing supply elasticity governs crash severity inside a single metropolitan housing market. Saiz (2010) established that across US metros, regions constrained by geography and regulation experience deeper boom-bust cycles than flexible ones. That finding is routinely applied downward to neighborhoods and ZIP codes as though the mechanism scaled without qualification.
The empirical record for the Washington DC and Northern Virginia region says it does not. Across 84 ZIP codes, measured supply elasticity ranges from 0.35 to 4.95 with a median of 1.21. The worst single-year price decline between 2007 and 2012 averaged 9.6 percent in constrained ZIP codes and 9.0 percent in flexible ones, a gap that cannot be distinguished from noise. Wide variation in the proposed cause, no meaningful separation in the proposed effect.
The model embeds households, houses and a metro-wide credit condition in the real ZIP geography of the region using three GIS layers and an empirical price panel. Local elasticity governs construction, exactly as theory predicts. Prices are driven by a shared macro drift schedule and, under the credit-amplified mode, by a leverage cycle with a financial accelerator and a deviation penalty. The design question is whether those shared forces are sufficient to override local supply differences at the sub-metropolitan scale.
…
Displaying 10 of 159 results for "Erle C Ellis" clear search