Geospatial Agent-Based Model of Immigrant Settlement Dynamics in Metro Vancouver (1.0.0)
This agent-based model simulates how new immigrant households choose where to live in Metro Vancouver under the origins diversity scenario. The model begins with 16,000 household agents, reflecting an expected annual population increase of about 42,500 people based on an average household size of 2.56. Each agent is assigned four characteristics: one of ten origin categories, income level (adjusted using NOC data and recent immigrant earnings), likelihood of having children, and preferred mode of commuting. The ten origin groups are drawn from Census patterns, including six subgroups within the broader Asian category (China, India, the Philippines, Iran, South Korea, and Other Asian countries) and two categories for immigrants from the Americas. This refined classification better captures the diversity of newcomers arriving in the region.
Release Notes
INSTRUCTIONS
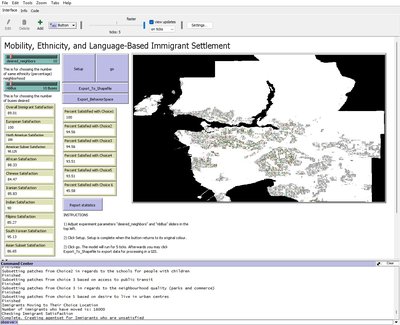
1) Adjust experiment parameters “desired_neighbors” and “nbBus” sliders in the top left.
2) Click Setup. Setup is complete when the button returns to its original colour.
2) Click go. The model will run for 5 ticks. Afterwards, you may click Export_To_Shapefile to export data for processing in a GIS.
Associated Publications
Perez, L., Yousefi, M., Mahdizadeh Gharakhanlou, N., Vukicevic, S., and Dragicevic, S., 2025. From Agent-Based Modeling to Urban Policy Strategy: Census-Validated Insights into Immigrant Settlement and Diversity in Metro Vancouver. Unpublished manuscript.
Geospatial Agent-Based Model of Immigrant Settlement Dynamics in Metro Vancouver 1.0.0
This agent-based model simulates how new immigrant households choose where to live in Metro Vancouver under the origins diversity scenario. The model begins with 16,000 household agents, reflecting an expected annual population increase of about 42,500 people based on an average household size of 2.56. Each agent is assigned four characteristics: one of ten origin categories, income level (adjusted using NOC data and recent immigrant earnings), likelihood of having children, and preferred mode of commuting. The ten origin groups are drawn from Census patterns, including six subgroups within the broader Asian category (China, India, the Philippines, Iran, South Korea, and Other Asian countries) and two categories for immigrants from the Americas. This refined classification better captures the diversity of newcomers arriving in the region.
Release Notes
INSTRUCTIONS
1) Adjust experiment parameters “desired_neighbors” and “nbBus” sliders in the top left.
2) Click Setup. Setup is complete when the button returns to its original colour.
2) Click go. The model will run for 5 ticks. Afterwards, you may click Export_To_Shapefile to export data for processing in a GIS.
