ZIP-Level Housing Supply Elasticity and Crash Dynamics: A GIS-Based Agent-Based Model of the Washington DC and Northern Virginia Metro Region (1.1.0)
This model tests whether local housing supply elasticity governs crash severity inside a single metropolitan housing market. Saiz (2010) established that across US metros, regions constrained by geography and regulation experience deeper boom-bust cycles than flexible ones. That finding is routinely applied downward to neighborhoods and ZIP codes as though the mechanism scaled without qualification.
The empirical record for the Washington DC and Northern Virginia region says it does not. Across 84 ZIP codes, measured supply elasticity ranges from 0.35 to 4.95 with a median of 1.21. The worst single-year price decline between 2007 and 2012 averaged 9.6 percent in constrained ZIP codes and 9.0 percent in flexible ones, a gap that cannot be distinguished from noise. Wide variation in the proposed cause, no meaningful separation in the proposed effect.
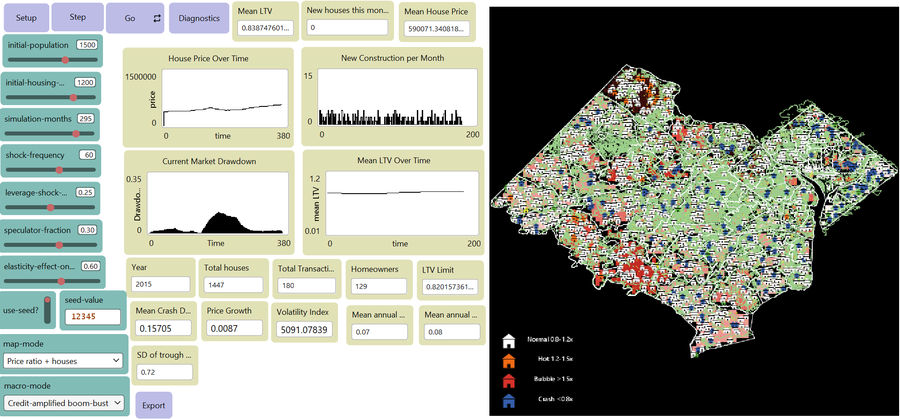
The model embeds households, houses and a metro-wide credit condition in the real ZIP geography of the region using three GIS layers and an empirical price panel. Local elasticity governs construction, exactly as theory predicts. Prices are driven by a shared macro drift schedule and, under the credit-amplified mode, by a leverage cycle with a financial accelerator and a deviation penalty. The design question is whether those shared forces are sufficient to override local supply differences at the sub-metropolitan scale.
Crash severity is never read into the simulation. Each ZIP code computes its own drawdown from its own realized price path, so whether crashes converge across the region is an emergent outcome rather than an assumption. Model prices are averaged into calendar years and scored with the same two estimators used on the empirical panel, which makes model output and observed data directly comparable. A third statistic, the standard deviation of the trough year across ZIP codes, measures how tightly the crash is clustered in time.
Two experimental conditions are provided. The deterministic mode runs the calibrated drift schedule alone. The credit-amplified mode adds credit transmission and an empirical anchor to the price equation. Runs are fully reproducible through a seed control, and each run writes a per-ZIP results file naming its mode and seed.
Requires NetLogo 7 and the gis, csv and table extensions. External GIS and panel data files are included in the data upload. File paths resolve automatically, so the model runs unchanged from the archive layout or from a working directory.
Release Notes
Version 1.1.0. Documentation revision. Model behaviour, parameters and output are unchanged from 1.0.0.
Two experimental conditions: a deterministic macro drift schedule, and a credit-amplified mode adding leverage transmission and an empirical price anchor. Model output is annualized and scored with the same estimators used on the empirical panel, so simulated and observed crash severity are directly comparable. Runs are reproducible through a seed control, and each run writes a per-ZIP results file naming its mode and seed.
Two runs are included in results, one per mode, both at seed 12345.
Known limitation: patch to polygon assignment requires a polygon to contain a whole patch, so ZIP codes smaller than one patch are absent. Approximately 72 of the 84 panel ZIP codes are represented at the default world resolution. See Section 7 of the documentation.
Associated Publications
Bari, M. M. (2026). ZIP-Level Housing Supply Elasticity and Crash Dynamics: A GIS-Based Agent-Based Model of the Washington DC and Northern Virginia Metro Region. Manuscript submitted for publication.
ZIP-Level Housing Supply Elasticity and Crash Dynamics: A GIS-Based Agent-Based Model of the Washington DC and Northern Virginia Metro Region 1.1.0
Submitted byMansoor Abdul BariPublished Aug 02, 2026
Last modified Aug 02, 2026
This model tests whether local housing supply elasticity governs crash severity inside a single metropolitan housing market. Saiz (2010) established that across US metros, regions constrained by geography and regulation experience deeper boom-bust cycles than flexible ones. That finding is routinely applied downward to neighborhoods and ZIP codes as though the mechanism scaled without qualification.
The empirical record for the Washington DC and Northern Virginia region says it does not. Across 84 ZIP codes, measured supply elasticity ranges from 0.35 to 4.95 with a median of 1.21. The worst single-year price decline between 2007 and 2012 averaged 9.6 percent in constrained ZIP codes and 9.0 percent in flexible ones, a gap that cannot be distinguished from noise. Wide variation in the proposed cause, no meaningful separation in the proposed effect.
The model embeds households, houses and a metro-wide credit condition in the real ZIP geography of the region using three GIS layers and an empirical price panel. Local elasticity governs construction, exactly as theory predicts. Prices are driven by a shared macro drift schedule and, under the credit-amplified mode, by a leverage cycle with a financial accelerator and a deviation penalty. The design question is whether those shared forces are sufficient to override local supply differences at the sub-metropolitan scale.
Crash severity is never read into the simulation. Each ZIP code computes its own drawdown from its own realized price path, so whether crashes converge across the region is an emergent outcome rather than an assumption. Model prices are averaged into calendar years and scored with the same two estimators used on the empirical panel, which makes model output and observed data directly comparable. A third statistic, the standard deviation of the trough year across ZIP codes, measures how tightly the crash is clustered in time.
Two experimental conditions are provided. The deterministic mode runs the calibrated drift schedule alone. The credit-amplified mode adds credit transmission and an empirical anchor to the price equation. Runs are fully reproducible through a seed control, and each run writes a per-ZIP results file naming its mode and seed.
Requires NetLogo 7 and the gis, csv and table extensions. External GIS and panel data files are included in the data upload. File paths resolve automatically, so the model runs unchanged from the archive layout or from a working directory.
Release Notes
Version 1.1.0. Documentation revision. Model behaviour, parameters and output are unchanged from 1.0.0.
Two experimental conditions: a deterministic macro drift schedule, and a credit-amplified mode adding leverage transmission and an empirical price anchor. Model output is annualized and scored with the same estimators used on the empirical panel, so simulated and observed crash severity are directly comparable. Runs are reproducible through a seed control, and each run writes a per-ZIP results file naming its mode and seed.
Two runs are included in results, one per mode, both at seed 12345.
Known limitation: patch to polygon assignment requires a polygon to contain a whole patch, so ZIP codes smaller than one patch are absent. Approximately 72 of the 84 panel ZIP codes are represented at the default world resolution. See Section 7 of the documentation.
No. It is an original model. Its credit module follows the leverage-cycle approach of Geanakoplos et al. (2012), but it does not replicate that model.
Associated Publication(s)
Bari, M. M. (2026). ZIP-Level Housing Supply Elasticity and Crash Dynamics: A GIS-Based Agent-Based Model of the Washington DC and Northern Virginia Metro Region. Manuscript submitted for publication.
Gabaix, X. (2011). The granular origins of aggregate fluctuations. Econometrica, 79(3), 733-772. https://doi.org/10.3982/ECTA8769
Geanakoplos, J., Axtell, R., Farmer, J. D., Howitt, P., Conlee, B., Goldstein, J., Hendrey, M., Palmer, N. M., & Yang, C.-Y. (2012). Getting at systemic risk via an agent-based model of the housing market. American Economic Review: Papers and Proceedings, 102(3), 53-58. https://doi.org/10.1257/aer.102.3.53
Mian, A., & Sufi, A. (2009). The consequences of mortgage credit expansion: Evidence from the U.S. mortgage default crisis. Quarterly Journal of Economics, 124(4), 1449-1496. https://doi.org/10.1162/qjec.2009.124.4.1449
Gyourko, J., Saiz, A., & Summers, A. (2008). A new measure of the local regulatory environment for housing markets: The Wharton Residential Land Use Regulatory Index. Urban Studies, 45(3), 693-729. https://doi.org/10.1177/0042098007087341
Clementi, F., & Gallegati, M. (2005). Pareto’s law of income distribution: Evidence for Germany, the United Kingdom, and the United States. In Econophysics of Wealth Distributions (pp. 3-14). Springer. https://doi.org/10.1007/88-470-0389-X_1
Grimm, V., Railsback, S. F., Vincenot, C. E., Berger, U., Gallagher, C., DeAngelis, D. L., et al. (2020). The ODD protocol for describing agent-based and other simulation models: A second update to improve clarity, replication, and structural realism. Journal of Artificial Societies and Social Simulation, 23(2), 7. https://doi.org/10.18564/jasss.4259
This website uses cookies and Google Analytics to help us track user engagement and improve our site. If
you'd like to know more information about what data we collect and why, please see
our data privacy policy. If you continue to use this site, you consent to
our use of cookies.