Computational Model Library

Torsten Hägerstrand’s Spatial Innovation Diffusion Model (1.1.0)

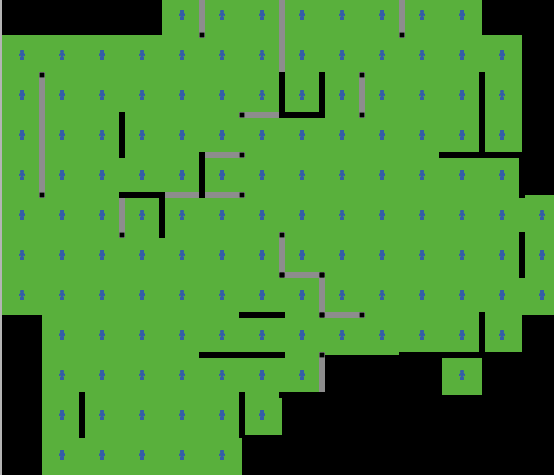
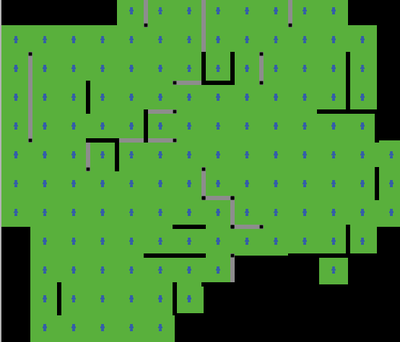
The purpose of this model is to understand the processes which create a “nebula-distribution,” a common spatial pattern. This model explores the way that the diffusion of ideas across a social network might produce this pattern. The model attempts to recreate the chronologic and geographic patterns produced in a historical example, the diffusion of the adoption of government subsidies for improved pasture on farms in Sweden. Two related models were outlined and studied by the author. The first model, referred to as the isotropic model, begins with a uniform population number and a 5x5 grid. This model is designed to show how innovation might spread on a limited scale. The second model, the anisotropic model, initializes with different numbers of agents on each patch, a larger more complex spatial area and is intended to recreate a specific case study. The models rely on real-world data to create some of the models’ parameters (e.g. probability distributions used in the model are calculated from actual migration data and telephone call data) and attempt to compare real world distributions of the spread of ideas with those predicted by the model.
th_replication.png

Release Notes

Associated Publications

Torsten Hägerstrand’s Spatial Innovation Diffusion Model 1.1.0

The purpose of this model is to understand the processes which create a “nebula-distribution,” a common spatial pattern. This model explores the way that the diffusion of ideas across a social network might produce this pattern. The model attempts to recreate the chronologic and geographic patterns produced in a historical example, the diffusion of the adoption of government subsidies for improved pasture on farms in Sweden. Two related models were outlined and studied by the author. The first model, referred to as the isotropic model, begins with a uniform population number and a 5x5 grid. This model is designed to show how innovation might spread on a limited scale. The second model, the anisotropic model, initializes with different numbers of agents on each patch, a larger more complex spatial area and is intended to recreate a specific case study. The models rely on real-world data to create some of the models’ parameters (e.g. probability distributions used in the model are calculated from actual migration data and telephone call data) and attempt to compare real world distributions of the spread of ideas with those predicted by the model.

Version Submitter First published Last modified Status
1.1.0 Sean Bergin Tue Oct 2 21:58:03 2012 Wed Apr 17 18:16:54 2019 Published Peer Reviewed https://doi.org/2286.0/oabm:3163
1.0.0 Sean Bergin Fri Sep 14 17:48:22 2012 Tue Feb 20 06:29:42 2018 Published

Discussion

This website uses cookies and Google Analytics to help us track user engagement and improve our site. If you'd like to know more information about what data we collect and why, please see our data privacy policy. If you continue to use this site, you consent to our use of cookies.
Accept