Toward Market Structure as a Complex System: A Web Based Simulation Assignment Implemented in Netlogo (1.0.0)
WHAT IS IT?
This is a Cournot model named after the French economist Antoine Augustin Cournot (1801-1877). It is commonly used to model imperfect competition in cases where firms have some market power and must choose a level of output to produce that considers the responses of their competitors as well. The resulting price and output end up somewhere between what perfect competition and monopoly markets would produce and is a Nash Equilibrium.
HOW IT WORKS
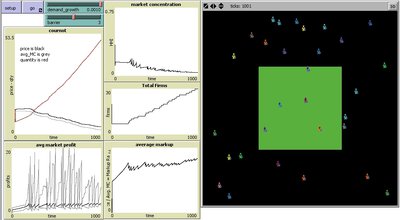
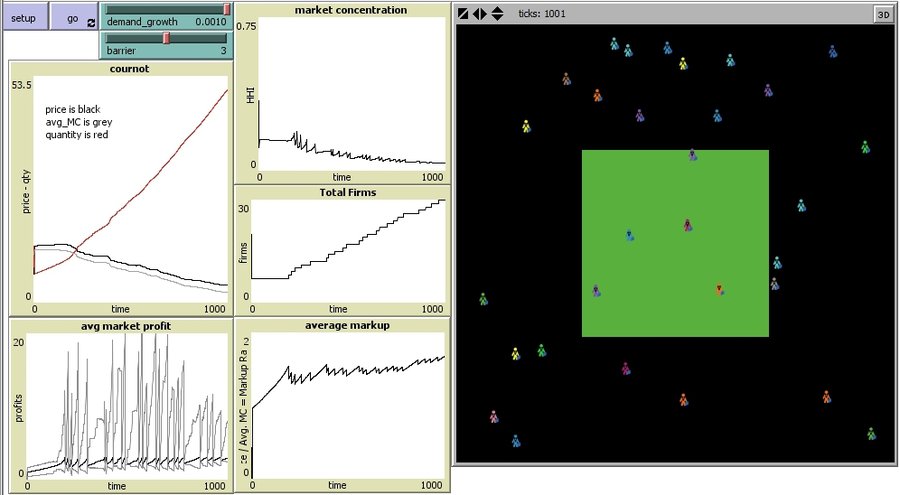
The simulation begins with 20 firms when you click the [SETUP] button. When you click the [GO] button the simulation begins and runs for 1000 time periods (days). At each point in time we can see, on the graphs, 1) the Cournot equilibrium market price and quantity, as well as average MC in the market, 2) the average profit of firms in the market, 3) the market concentration as measured with the HHI (Herfindal-Hirschman Index), 4) the number of firms in the market, and 5) the average price markup or (Price/Avg.MC).
In this simulation, firms are moving randomly across a business landscape. When they enter the green patch in the center they spend some of their accumulated profits on productivity innovations, assuming they have accumulated such profits. This lowers their marginal costs and gives them an advantage over their competitors. For the innovating firm, this leads to more market share, higher profits, and increased market concentration.
HOW TO USE IT
There are two parameters that can be adjusted to affect how the simulation plays out.
1) Demand growth, setting this to a positive value means that the market demand curve gradually increases over time.
2) Barriers to entry, determine how costly it is for new firms to enter the market. At the lowest setting we have perfect competition conditions. At high setting we have oligopoly or even monopoly conditions.
THINGS TO NOTICE
1) If HHI is increasing then either some firms are gaining market share from others, or, firms are exiting the market creating more market share for the remaining firms. It is likely that both affects are occurring simultaneously.
2) If number of firms is increasing then HHI should on average decrease (unless, due to the other affect discussed above some firms are gaining market share over the new entrants).
3) As the market becomes more concentrated market prices should increase.
4) As average profitability increases this creates the incentive for new firms to enter (depending on the level of barriers).
5) Chaotic events can happen in a dynamic setting with several interacting components. As new firms enter, innovate, increase profits, etc. the results may be quite predictable and smooth or in some cases may be chaotic with wild fluctuations.
note: when the simulation stops before 1000 rounds it means that all firms have exited the market, even the last remaining firm which was a monopolist.
Release Notes
Associated Publications
This release is out-of-date. The latest version is
1.1.0
Toward Market Structure as a Complex System: A Web Based Simulation Assignment Implemented in Netlogo 1.0.0
Submitted byTimothy KochanskiPublished Feb 14, 2011
Last modified Feb 23, 2018
WHAT IS IT?
This is a Cournot model named after the French economist Antoine Augustin Cournot (1801-1877). It is commonly used to model imperfect competition in cases where firms have some market power and must choose a level of output to produce that considers the responses of their competitors as well. The resulting price and output end up somewhere between what perfect competition and monopoly markets would produce and is a Nash Equilibrium.
HOW IT WORKS
The simulation begins with 20 firms when you click the [SETUP] button. When you click the [GO] button the simulation begins and runs for 1000 time periods (days). At each point in time we can see, on the graphs, 1) the Cournot equilibrium market price and quantity, as well as average MC in the market, 2) the average profit of firms in the market, 3) the market concentration as measured with the HHI (Herfindal-Hirschman Index), 4) the number of firms in the market, and 5) the average price markup or (Price/Avg.MC).
In this simulation, firms are moving randomly across a business landscape. When they enter the green patch in the center they spend some of their accumulated profits on productivity innovations, assuming they have accumulated such profits. This lowers their marginal costs and gives them an advantage over their competitors. For the innovating firm, this leads to more market share, higher profits, and increased market concentration.
HOW TO USE IT
There are two parameters that can be adjusted to affect how the simulation plays out.
1) Demand growth, setting this to a positive value means that the market demand curve gradually increases over time.
2) Barriers to entry, determine how costly it is for new firms to enter the market. At the lowest setting we have perfect competition conditions. At high setting we have oligopoly or even monopoly conditions.
THINGS TO NOTICE
1) If HHI is increasing then either some firms are gaining market share from others, or, firms are exiting the market creating more market share for the remaining firms. It is likely that both affects are occurring simultaneously.
2) If number of firms is increasing then HHI should on average decrease (unless, due to the other affect discussed above some firms are gaining market share over the new entrants).
3) As the market becomes more concentrated market prices should increase.
4) As average profitability increases this creates the incentive for new firms to enter (depending on the level of barriers).
5) Chaotic events can happen in a dynamic setting with several interacting components. As new firms enter, innovate, increase profits, etc. the results may be quite predictable and smooth or in some cases may be chaotic with wild fluctuations.
note: when the simulation stops before 1000 rounds it means that all firms have exited the market, even the last remaining firm which was a monopolist.
Cite this Model
Timothy Kochanski (2013, April 27). “Toward Market Structure as a Complex System: A Web Based Simulation Assignment Implemented in Netlogo” (Version 1.0.0). CoMSES Computational Model Library. Retrieved from: https://www.comses.net/codebases/2313/releases/1.0.0/
Create an Open Code Badge that links to this model more info
This model has not been reviewed by CoMSES Net and should be independently reviewed to
meet the Open Code Badge guidelines.
You can use the following HTML or Markdown code to create an Open Code Badge that links to
version 1.0.0
of this computational model.
This website uses cookies and Google Analytics to help us track user engagement and improve our site. If
you'd like to know more information about what data we collect and why, please see
our data privacy policy. If you continue to use this site, you consent to
our use of cookies.