About the CoMSES Model Library more info
Our mission is to help computational modelers at all levels engage in the establishment and adoption of community standards and good practices for developing and sharing computational models. Model authors can freely publish their model source code in the Computational Model Library alongside narrative documentation, open science metadata, and other emerging open science norms that facilitate software citation, reproducibility, interoperability, and reuse. Model authors can also request peer review of their computational models to receive a DOI.
All users of models published in the library must cite model authors when they use and benefit from their code.
Please check out our model publishing tutorial and contact us if you have any questions or concerns about publishing your model(s) in the Computational Model Library.
We also maintain a curated database of over 7500 publications of agent-based and individual based models with additional detailed metadata on availability of code and bibliometric information on the landscape of ABM/IBM publications that we welcome you to explore.
Displaying 5 of 35 results for "Rallou Thomopoulos" clear search
Peer reviewed SequiaBasalto model
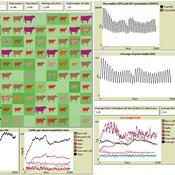
Marco Janssen Irene Perez Ibarra Pierre Bommel Diego J. Soler-Navarro Alicia Tenza Peral Francisco Dieguez Cameroni | Published Friday, May 26, 2023This is a replication of the SequiaBasalto model, originally built in Cormas by Dieguez Cameroni et al. (2012, 2014, Bommel et al. 2014 and Morales et al. 2015). The model aimed to test various adaptations of livestock producers to the drought phenomenon provoked by climate change. For that purpose, it simulates the behavior of one livestock farm in the Basaltic Region of Uruguay. The model incorporates the price of livestock, fodder and paddocks, as well as the growth of grass as a function of climate and seasons (environmental submodel), the life cycle of animals feeding on the pasture (livestock submodel), and the different strategies used by farmers to manage their livestock (management submodel). The purpose of the model is to analyze to what degree the common management practices used by farmers (i.e., proactive and reactive) to cope with seasonal and interannual climate variations allow to maintain a sustainable livestock production without depleting the natural resources (i.e., pasture). Here, we replicate the environmental and livestock submodel using NetLogo.
One year is 368 days. Seasons change every 92 days. Each day begins with the growth of grass as a function of climate and season. This is followed by updating the live weight of cows according to the grass height of their patch, and grass consumption, which is determined based on the updated live weight. After consumption, cows grow and reproduce, and a new grass height is calculated. Cows then move to the patch with less cows and with the highest grass height. This updated grass height value will be the initial grass height for the next day.
A Complex Model of Voter Turnout
Bruce Edmonds Laurence Lessard-Phillips Ed Fieldhouse | Published Monday, October 13, 2014 | Last modified Tuesday, August 18, 2015This is a complex “Data Integration Model”, following a “KIDS” rather than a “KISS” methodology - guided by the available evidence. It looks at the complex mix of social processes that may determine why people vote or not.
MERCURY extension: population
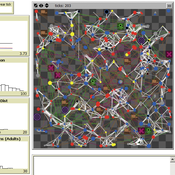
Tom Brughmans | Published Thursday, May 23, 2019This model is an extended version of the original MERCURY model (https://www.comses.net/codebases/4347/releases/1.1.0/ ) . It allows for experiments to be performed in which empirically informed population sizes of sites are included, that allow for the scaling of the number of tableware traders with the population of settlements, and for hypothesised production centres of four tablewares to be used in experiments.
Experiments performed with this population extension and substantive interpretations derived from them are published in:
Hanson, J.W. & T. Brughmans. In press. Settlement scale and economic networks in the Roman Empire, in T. Brughmans & A.I. Wilson (ed.) Simulating Roman Economies. Theories, Methods and Computational Models. Oxford: Oxford University Press.
…
Model of communication between two groups of managers in the course of project implementation
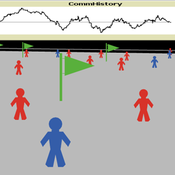
Smarzhevskiy Ivan | Published Monday, December 07, 2020This is a simulation model of communication between two groups of managers in the course of project implementation. The “world” of the model is a space of interaction between project participants, each of which belongs either to a group of work performers or to a group of customers. Information about the progress of the project is publicly available and represents the deviation Earned value (EV) from the planned project value (cost baseline).
The key elements of the model are 1) persons belonging to a group of customers or performers, 2) agents that are communication acts. The life cycle of persons is equal to the time of the simulation experiment, the life cycle of the communication act is 3 periods of model time (for the convenience of visualizing behavior during the experiment). The communication act occurs at a specific point in the model space, the coordinates of which are realized as random variables. During the experiment, persons randomly move in the model space. The communication act involves persons belonging to a group of customers and a group of performers, remote from the place of the communication act at a distance not exceeding the value of the communication radius (MaxCommRadius), while at least one representative from each of the groups must participate in the communication act. If none are found, the communication act is not carried out. The number of potential communication acts per unit of model time is a parameter of the model (CommPerTick).
The managerial sense of the feedback is the stimulating effect of the positive value of the accumulated communication complexity (positive background of the project implementation) on the productivity of the performers. Provided there is favorable communication (“trust”, “mutual understanding”) between the customer and the contractor, it is more likely that project operations will be performed with less lag behind the plan or ahead of it.
The behavior of agents in the world of the model (change of coordinates, visualization of agents’ belonging to a specific communicative act at a given time, etc.) is not informative. Content data are obtained in the form of time series of accumulated communicative complexity, the deviation of the earned value from the planned value, average indicators characterizing communication - the total number of communicative acts and the average number of their participants, etc. These data are displayed on graphs during the simulation experiment.
The control elements of the model allow seven independent values to be varied, which, even with a minimum number of varied values (three: minimum, maximum, optimum), gives 3^7 = 2187 different variants of initial conditions. In this case, the statistical processing of the results requires repeated calculation of the model indicators for each grid node. Thus, the set of varied parameters and the range of their variation is determined by the logic of a particular study and represents a significant narrowing of the full set of initial conditions for which the model allows simulation experiments.
…
We propose here a computational model of school segregation that is aligned with a corresponding Schelling-type model of residential segregation. To adapt the model for application to school segregation, we move beyond previous work by combining two preference arguments in modeling parents’ school choice, preferences for the ethnic composition of a school and preferences for minimizing the travelling distance to the school.
Displaying 5 of 35 results for "Rallou Thomopoulos" clear search