soslivestock model 1.1.0
The purpose of this model is to analyze how different management strategies affect the wellbeing, sustainability and resilience of an extensive livestock system under scenarios of climate change and landscape configurations. For this purpose, it simulates one cattle farming system, in which agents (cattle) move through the space using resources (grass). Three farmer profiles are considered: 1) a subsistence farmer that emphasizes self-sufficiency and low costs with limited attention to herd management practices, 2) a commercial farmer focused on profit maximization through efficient production methods, and 3) an environmental farmer that prioritizes conservation of natural resources and animal welfare over profit maximization. These three farmer profiles share the same management strategies to adapt to climate and resource conditions, but differ in their goals and decision-making criteria for when, how, and whether to implement those strategies. This model is based on the SequiaBasalto model (Dieguez Cameroni et al. 2012, 2014, Bommel et al. 2014 and Morales et al. 2015), replicated in NetLogo by Soler-Navarro et al. (2023).
One year is 368 days. Seasons change every 92 days. Each step begins with the growth of grass as a function of climate and season. This is followed by updating the live weight of animals according to the grass height of their patch, and grass consumption, which is determined based on the updated live weight. Animals can be supplemented by the farmer in case of severe drought. After consumption, cows grow and reproduce, and a new grass height is calculated. This updated grass height value becomes the starting grass height for the next day. Cows then move to the next area with the highest grass height. After that, cattle prices are updated and cattle sales are held on the first day of fall. In the event of a severe drought, special sales are held. Finally, at the end of the day, the farm balance and the farmer’s effort are calculated.

Release Notes
1) The logic of how the different climacoef values in the historical-climacoef list are synchronized with each season has been improved: I added a new variable called “clock-historical-climacoef” to more efficiently synchronize each climacoef value with each season, and this new variable is also used to stop the model once the historical-climacoef list is finished (thus preventing the model from returning an error message as it did before).
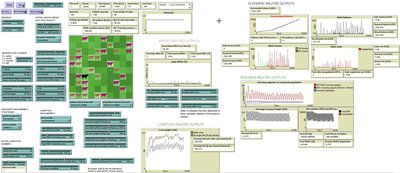
2) Previously, the “Accumulated balance” and “Stocking rate” plots had their titles in red, indicating that something wasn’t quite right (although it didn’t affect the correct performance of the model). This has been fixed by doing the following:
- In the code, within the “setup-globals procedure”, I changed “set balance-historyXticks []” to “set balance-historyXticks 0”. I did the same for the the other variables with “xxxxxx-historyXticks-xxx”
- In the “Stocking rate plot”: apparently there is an option to not plot a value, using plot-pen-up, so in the pen update commands I have written: ifelse (spatial-management = “rotational grazing”) [plot paddock-SR][plot-pen-up]. In this way, the line “Paddock-SR” is only displayed when rotational grazing management is in effect.
3) In the “Carrying capacity vs Livestock population” plot, I have changed the pen update commands for the “EST. Carrying capacity (only for Env. farmer)” pen: ifelse (farmer-profile = “environmental”) [plot estimated-carrying-capacity ][plot-pen-up]. In this way, this line will only be displayed when environmental farmer profile is selected.