About the CoMSES Model Library more info
Our mission is to help computational modelers at all levels engage in the establishment and adoption of community standards and good practices for developing and sharing computational models. Model authors can freely publish their model source code in the Computational Model Library alongside narrative documentation, open science metadata, and other emerging open science norms that facilitate software citation, reproducibility, interoperability, and reuse. Model authors can also request peer review of their computational models to receive a DOI.
All users of models published in the library must cite model authors when they use and benefit from their code.
Please check out our model publishing tutorial and contact us if you have any questions or concerns about publishing your model(s) in the Computational Model Library.
We also maintain a curated database of over 7500 publications of agent-based and individual based models with additional detailed metadata on availability of code and bibliometric information on the landscape of ABM/IBM publications that we welcome you to explore.
Displaying 10 of 27 results statistical clear
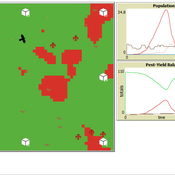
Peer reviewed Avian pest control: Yield outcome due to insectivorous birds, falconry, and integration of nest boxes.
David Jung | Published Monday, November 13, 2023 | Last modified Sunday, November 19, 2023The model aims to simulate predator-prey relationships in an agricultural setting. The focus lies on avian communities and their effect on different pest organisms (here: pest birds, rodents, and arthropod pests). Since most case studies focused on the impact on arthropod pests (AP) alone, this model attempts to include effects on yield outcome. By incorporating three treatments with different factor levels (insectivorous bird species, falconry, nest box density) an experimental setup is given that allows for further statistical analysis to identify an optimal combination of the treatments.
In light of a global decline of birds, insects, and many other groups of organisms, alternative practices of pest management are heavily needed to reduce the input of pesticides. Avian pest control therefore poses an opportunity to bridge the disconnect between humans and nature by realizing ecosystem services and emphasizing sustainable social ecological systems.
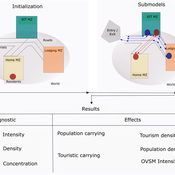
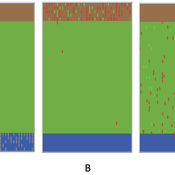
Peer reviewed ABM Overtourism Santa Marta
Janwar Moreno | Published Monday, October 23, 2023This model presents the simulation model of a city in the context of overtourism. The study area is the city of Santa Marta in Colombia. The purpose is to illustrate the spatial and temporal distribution of population and tourists in the city. The simulation analyzes emerging patterns that result from the interaction between critical components in the touristic urban system: residents, urban space, touristic sites, and tourists. The model is an Agent-Based Model (ABM) with the GAMA software. Also, it used public input data from statistical centers, geographical information systems, tourist websites, reports, and academic articles. The ABM includes assessing some measures used to address overtourism. This is a field of research with a low level of analysis for destinations with overtourism, but the ABM model allows it. The results indicate that the city has a high risk of overtourism, with spatial and temporal differences in the population distribution, and it illustrates the effects of two management measures of the phenomenon on different scales. Another interesting result is the proposed tourism intensity indicator (OVsm), taking into account that the tourism intensity indicators used by the literature on overtourism have an overestimation of tourism pressures.
Youth and their Artificial Social Environmental Risk and Promotive Scores (Ya-TASERPS)
JoAnn Lee | Published Wednesday, July 07, 2021 | Last modified Friday, February 24, 2023Risk assessments are designed to measure cumulative risk and promotive factors for delinquency and recidivism, and are used by criminal and juvenile justice systems to inform sanctions and interventions. Yet, these risk assessments tend to focus on individual risk and often fail to capture each individual’s environmental risk. This agent-based model (ABM) explores the interaction of individual and environmental risk on the youth. The ABM is based on an interactional theory of delinquency and moves beyond more traditional statistical approaches used to study delinquency that tend to rely on point-in-time measures, and to focus on exploring the dynamics and processes that evolve from interactions between agents (i.e., youths) and their environments. Our ABM simulates a youth’s day, where they spend time in schools, their neighborhoods, and families. The youth has proclivities for engaging in prosocial or antisocial behaviors, and their environments have likelihoods of presenting prosocial or antisocial opportunities.
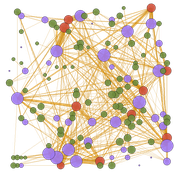
Peer reviewed TRANSOPE: a multi-agent model to simulate outsourcing networks in road freight transport.
Aitor Salas-Peña Blanca Rosa Cases Gutiérrez | Published Friday, October 21, 2022A road freight transport (RFT) operation involves the participation of several types of companies in its execution. The TRANSOPE model simulates the subcontracting process between 3 types of companies: Freight Forwarders (FF), Transport Companies (TC) and self-employed carriers (CA). These companies (agents) form transport outsourcing chains (TOCs) by making decisions based on supplier selection criteria and transaction acceptance criteria. Through their participation in TOCs, companies are able to learn and exchange information, so that knowledge becomes another important factor in new collaborations. The model can replicate multiple subcontracting situations at a local and regional geographic level.
The succession of n operations over d days provides two types of results: 1) Social Complex Networks, and 2) Spatial knowledge accumulation environments. The combination of these results is used to identify the emergence of new logistics clusters. The types of actors involved as well as the variables and parameters used have their justification in a survey of transport experts and in the existing literature on the subject.
As a result of a preferential selection process, the distribution of activity among agents shows to be highly uneven. The cumulative network resulting from the self-organisation of the system suggests a structure similar to scale-free networks (Albert & Barabási, 2001). In this sense, new agents join the network according to the needs of the market. Similarly, the network of preferential relationships persists over time. Here, knowledge transfer plays a key role in the assignment of central connector roles, whose participation in the outsourcing network is even more decisive in situations of scarcity of transport contracts.
Leviathan group model and its approximation
Thibaut Roubin Guillaume Deffuant | Published Tuesday, July 26, 2022The model is based on the influence function of the Leviathan model (Deffuant, Carletti, Huet 2013 and Huet and Deffuant 2017) with the addition of group idenetity. We aim at better explaining some patterns generated by this model, using a derived mathematical approximation of the evolution of the opinions averaged.
We consider agents having an opinion/esteem about each other and about themselves. During dyadic meetings, agents change their respective opinion about each other, and possibly about other agents they gossip about, with a noisy perception of the opinions of their interlocutor. Highly valued agents are more influential in such encounters. Moreover, each agent belongs to a single group and the opinions within the group are attracted to their average.
We show that a group hierarchy can emerges from this model, and that the inequality of reputations among groups have a negative effect on the opinions about the groups of low status. The mathematical analysis of the opinion dynamic shows that the lower the status of the group, the more detrimental the interactions with the agents of other groups are for the opinions about this group, especially when gossip is activated. However, the interactions between agents of the same group tend to have a positive effect on the opinions about this group.
Leviathan model and its approximation
Thibaut Roubin Guillaume Deffuant | Published Thursday, September 17, 2020 | Last modified Monday, September 06, 2021The model is based on the influence function of the Leviathan model (Deffuant, Carletti, Huet 2013 and Huet and Deffuant 2017). We aim at better explaining some patterns generated by this model, using a derived mathematical approximation of the evolution of the opinions averaged.
We consider agents having an opinion/esteem about each other and about themselves. During dyadic meetings, agents change their respective opinion about each other, and possibly about other agents they gossip about, with a noisy perception of the opinions of their interlocutor. Highly valued agents are more influential in such encounters.
We show that the inequality of reputations among agents have a negative effect on the opinions about the agents of low status.The mathematical analysis of the opinion dynamic shows that the lower the status of the agent, the more detrimental the interactions are for the opinions about this agent, especially when gossip is activated, while the interactions always tend to increase the opinions about agents of high status.
User Guide and Templates for RAT-RS (a reporting standard for improving the documentation of data use in agent-based modelling)
Peer-Olaf Siebers Sebastian Achter Melania Borit Edmund Chattoe-Brown | Published Saturday, March 12, 2022The Rigor and Transparency Reporting Standard (RAT-RS) is a tool to improve the documentation of data use in Agent-Based Modelling. Following the development of reporting standards for models themselves, attention to empirical models has now reached a stage where these standards need to take equally effective account of data use (which until now has tended to be an afterthought to model description). It is particularly important that a standard should allow the reporting of the different uses to which data may be put (specification, calibration and validation), but also that it should be compatible with the integration of different kinds of data (for example statistical, qualitative, ethnographic and experimental) sometimes known as mixed methods research.
For the full details on the RAT-RS, please refer to the related publication “RAT-RS: A Reporting Standard for Improving the Documentation of Data Use in Agent-Based Modelling” (http://dx.doi.org/10.1080/13645579.2022.2049511).
Here we provide supplementary material for this article, consisting of a RAT-RS user guide and RAT-RS templates.
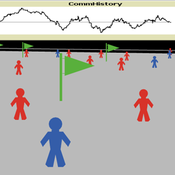
Model of communication between two groups of managers in the course of project implementation
Smarzhevskiy Ivan | Published Monday, December 07, 2020This is a simulation model of communication between two groups of managers in the course of project implementation. The “world” of the model is a space of interaction between project participants, each of which belongs either to a group of work performers or to a group of customers. Information about the progress of the project is publicly available and represents the deviation Earned value (EV) from the planned project value (cost baseline).
The key elements of the model are 1) persons belonging to a group of customers or performers, 2) agents that are communication acts. The life cycle of persons is equal to the time of the simulation experiment, the life cycle of the communication act is 3 periods of model time (for the convenience of visualizing behavior during the experiment). The communication act occurs at a specific point in the model space, the coordinates of which are realized as random variables. During the experiment, persons randomly move in the model space. The communication act involves persons belonging to a group of customers and a group of performers, remote from the place of the communication act at a distance not exceeding the value of the communication radius (MaxCommRadius), while at least one representative from each of the groups must participate in the communication act. If none are found, the communication act is not carried out. The number of potential communication acts per unit of model time is a parameter of the model (CommPerTick).
The managerial sense of the feedback is the stimulating effect of the positive value of the accumulated communication complexity (positive background of the project implementation) on the productivity of the performers. Provided there is favorable communication (“trust”, “mutual understanding”) between the customer and the contractor, it is more likely that project operations will be performed with less lag behind the plan or ahead of it.
The behavior of agents in the world of the model (change of coordinates, visualization of agents’ belonging to a specific communicative act at a given time, etc.) is not informative. Content data are obtained in the form of time series of accumulated communicative complexity, the deviation of the earned value from the planned value, average indicators characterizing communication - the total number of communicative acts and the average number of their participants, etc. These data are displayed on graphs during the simulation experiment.
The control elements of the model allow seven independent values to be varied, which, even with a minimum number of varied values (three: minimum, maximum, optimum), gives 3^7 = 2187 different variants of initial conditions. In this case, the statistical processing of the results requires repeated calculation of the model indicators for each grid node. Thus, the set of varied parameters and the range of their variation is determined by the logic of a particular study and represents a significant narrowing of the full set of initial conditions for which the model allows simulation experiments.
…

06b EiLab_Model_I_V5.00 NL
Garvin Boyle | Published Saturday, October 05, 2019EiLab - Model I - is a capital exchange model. That is a type of economic model used to study the dynamics of modern money which, strangely, is very similar to the dynamics of energetic systems. It is a variation on the BDY models first described in the paper by Dragulescu and Yakovenko, published in 2000, entitled “Statistical Mechanics of Money”. This model demonstrates the ability of capital exchange models to produce a distribution of wealth that does not have a preponderance of poor agents and a small number of exceedingly wealthy agents.
This is a re-implementation of a model first built in the C++ application called Entropic Index Laboratory, or EiLab. The first eight models in that application were labeled A through H, and are the BDY models. The BDY models all have a single constraint - a limit on how poor agents can be. That is to say that the wealth distribution is bounded on the left. This ninth model is a variation on the BDY models that has an added constraint that limits how wealthy an agent can be? It is bounded on both the left and right.
EiLab demonstrates the inevitable role of entropy in such capital exchange models, and can be used to examine the connections between changing entropy and changes in wealth distributions at a very minute level.
…
06 EiLab V1.40 – Entropic Index Laboratory
Garvin Boyle | Published Monday, March 19, 2018There is a new type of economic model called a capital exchange model, in which the biophysical economy is abstracted away, and the interaction of units of money is studied. Benatti, Drăgulescu and Yakovenko described at least eight capital exchange models – now referred to collectively as the BDY models – which are replicated as models A through H in EiLab. In recent writings, Yakovenko goes on to show that the entropy of these monetarily isolated systems rises to a maximal possible value as the model approaches steady state, and remains there, in analogy of the 2nd law of thermodynamics. EiLab demonstrates this behaviour. However, it must be noted that we are NOT talking about thermodynamic entropy. Heat is not being modeled – only simple exchanges of cash. But the same statistical formulae apply.
In three unpublished papers and a collection of diary notes and conference presentations (all available with this model), the concept of “entropic index” is defined for use in agent-based models (ABMs), with a particular interest in sustainable economics. Models I and J of EiLab are variations of the BDY model especially designed to study the Maximum Entropy Principle (MEP – model I) and the Maximum Entropy Production Principle (MEPP – model J) in ABMs. Both the MEPP and H.T. Odum’s Maximum Power Principle (MPP) have been proposed as organizing principles for complex adaptive systems. The MEPP and the MPP are two sides of the same coin, and an understanding of their implications is key, I believe, to understanding economic sustainability. Both of these proposed (and not widely accepted) principles describe the role of entropy in non-isolated systems in which complexity is generated and flourishes, such as ecosystems, and economies.
EiLab is one of several models exploring the dynamics of sustainable economics – PSoup, ModEco, EiLab, OamLab, MppLab, TpLab, and CmLab.
Displaying 10 of 27 results statistical clear