About the CoMSES Model Library more info
Our mission is to help computational modelers at all levels engage in the establishment and adoption of community standards and good practices for developing and sharing computational models. Model authors can freely publish their model source code in the Computational Model Library alongside narrative documentation, open science metadata, and other emerging open science norms that facilitate software citation, reproducibility, interoperability, and reuse. Model authors can also request peer review of their computational models to receive a DOI.
All users of models published in the library must cite model authors when they use and benefit from their code.
Please check out our model publishing tutorial and contact us if you have any questions or concerns about publishing your model(s) in the Computational Model Library.
We also maintain a curated database of over 7500 publications of agent-based and individual based models with additional detailed metadata on availability of code and bibliometric information on the landscape of ABM/IBM publications that we welcome you to explore.
Displaying 10 of 395 results simulation clear
Peer reviewed ABM Overtourism Santa Marta
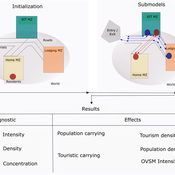
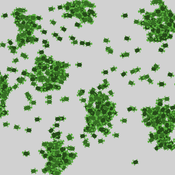
Janwar Moreno | Published Monday, October 23, 2023This model presents the simulation model of a city in the context of overtourism. The study area is the city of Santa Marta in Colombia. The purpose is to illustrate the spatial and temporal distribution of population and tourists in the city. The simulation analyzes emerging patterns that result from the interaction between critical components in the touristic urban system: residents, urban space, touristic sites, and tourists. The model is an Agent-Based Model (ABM) with the GAMA software. Also, it used public input data from statistical centers, geographical information systems, tourist websites, reports, and academic articles. The ABM includes assessing some measures used to address overtourism. This is a field of research with a low level of analysis for destinations with overtourism, but the ABM model allows it. The results indicate that the city has a high risk of overtourism, with spatial and temporal differences in the population distribution, and it illustrates the effects of two management measures of the phenomenon on different scales. Another interesting result is the proposed tourism intensity indicator (OVsm), taking into account that the tourism intensity indicators used by the literature on overtourism have an overestimation of tourism pressures.
Controlling the misinformation diffusion in social media by the effect of different classes of agents
Ali Khodabandeh Yalabadi | Published Thursday, October 05, 2023An agent-based framework to simulate the diffusion process of a piece of misinformation according to the SBFC model in which the fake news and its debunking compete in a social network. Considering new classes of agents, this model is closer to reality and proposed different strategies how to mitigate and control misinformation.
Peer reviewed An extended replication of Abelson's and Bernstein's community referendum simulation
Klaus Troitzsch | Published Friday, October 25, 2019 | Last modified Friday, August 25, 2023This is an extended replication of Abelson’s and Bernstein’s early computer simulation model of community referendum controversies which was originally published in 1963 and often cited, but seldom analysed in detail. This replication is in NetLogo 6.3.0, accompanied with an ODD+D protocol and class and sequence diagrams.
This replication replaces the original scales for attitude position and interest in the referendum issue which were distributed between 0 and 1 with values that are initialised according to a normal distribution with mean 0 and variance 1 to make simulation results easier compatible with scales derived from empirical data collected in surveys such as the European Value Study which often are derived via factor analysis or principal component analysis from the answers to sets of questions.
Another difference is that this model is not only run for Abelson’s and Bernstein’s ten week referendum campaign but for an arbitrary time in order that one can find out whether the distributions of attitude position and interest in the (still one-dimensional) issue stabilise in the long run.
Gender Disparity in COVID-19’s Impact on Academic Careers: An Agent-Based Model
Mai Trinh Chantal van Esch | Published Tuesday, September 26, 2023Prior to COVID-19, female academics accounted for 45% of assistant professors, 37% of associate professors, and 21% of full professors in business schools (Morgan et al., 2021). The pandemic arguably widened this gender gap, but little systemic data exists to quantify it. Our study set out to answer two questions: (1) How much will the COVID-19 pandemic have impacted the gender gap in U.S. business school tenured and tenure-track faculty? and (2) How much will institutional policies designed to help faculty members during the pandemic have affected this gender gap? We used agent-based modeling coupled with archival data to develop a simulation of the tenure process in business schools in the U.S. and tested how institutional interventions would affect this gender gap. Our simulations demonstrated that the gender gap in U.S. business schools was on track to close but would need further interventions to reach equality (50% females). In the long-term picture, COVID-19 had a small impact on the gender gap, as did dependent care assistance and tenure extensions (unless only women received tenure extensions). Changing performance evaluation methods to better value teaching and service activities and increasing the proportion of female new hires would help close the gender gap faster.
A replication and extension of the Taylor's Simulation Model of Insurance Market Dynamics in C#
Rei England | Published Sunday, September 24, 2023A simple model is constructed using C# in order to to capture key features of market dynamics, while also producing reasonable results for the individual insurers. A replication of Taylor’s model is also constructed in order to compare results with the new premium setting mechanism. To enable the comparison of the two premium mechanisms, the rest of the model set-up is maintained as in the Taylor model. As in the Taylor example, homogeneous customers represented as a total market exposure which is allocated amongst the insurers.
In each time period, the model undergoes the following steps:
1. Insurers set competitive premiums per exposure unit
2. Losses are generated based on each insurer’s share of the market exposure
3. Accounting results are calculated for each insurer
…
An Agent-Based Model of an Insurance Market driven by Supply and Demand with Imperfectly Estimated Strategies in C#
Rei England | Published Sunday, September 24, 2023This is a simulation of an insurance market where the premium moves according to the balance between supply and demand. In this model, insurers set their supply with the aim of maximising their expected utility gain while operating under imperfect information about both customer demand and underlying risk distributions.
There are seven types of insurer strategies. One type follows a rational strategy within the bounds of imperfect information. The other six types also seek to maximise their utility gain, but base their market expectations on a chartist strategy. Under this strategy, market premium is extrapolated from trends based on past insurance prices. This is subdivided according to whether the insurer is trend following or a contrarian (counter-trend), and further depending on whether the trend is estimated from short-term, medium-term, or long-term data.
Customers are modelled as a whole and allocated between insurers according to available supply. Customer demand is calculated according to a logit choice model based on the expected utility gain of purchasing insurance for an average customer versus the expected utility gain of non-purchase.
A Data-Driven Approach of Layout Evaluation for Electric Vehicle Charging Infrastructure Using Agent-Based Simulation and GIS
yue zhang | Published Thursday, September 21, 2023The development and popularisation of new energy vehicles have become a global consensus. The shortage and unreasonable layout of electric vehicle charging infrastructure (EVCI) have severely restricted the development of electric vehicles. In the literature, many methods can be used to optimise the layout of charging stations (CSs) for producing good layout designs. However, more realistic evaluation and validation should be used to assess and validate these layout options. This study suggested an agent-based simulation (ABS) model to evaluate the layout designs of EVCI and simulate the driving and charging behaviours of electric taxis (ETs). In the case study of Shenzhen, China, GPS trajectory data were used to extract the temporal and spatial patterns of ETs, which were then used to calibrate and validate the actions of ETs in the simulation. The ABS model was developed in a GIS context of an urban road network with travelling speeds of 24 h to account for the effects of traffic conditions. After the high-resolution simulation, evaluation results of the performance of EVCI and the behaviours of ETs can be provided in detail and in summary. Sensitivity analysis demonstrates the accuracy of simulation implementation and aids in understanding the effect of model parameters on system performance. Maximising the time satisfaction of ET users and reducing the workload variance of EVCI were the two goals of a multiobjective layout optimisation technique based on the Pareto frontier. The location plans for the new CS based on Pareto analysis can significantly enhance both metrics through simulation evaluation.
Peer reviewed An agent-based simulation model of pedestrian evacuation based on Bayesian Nash Equilibrium
Yiyu Wang Jiaqi Ge Alexis Comber | Published Wednesday, July 06, 2022This ABM aims to introduce a new individual decision-making model, BNE into the ABM of pedestrian evacuation to properly model individual behaviours and motions in emergency situations. Three types of behavioural models has been developed, which are Shortest Route (SR) model, Random Follow (RF) model, and BNE model, to better reproduce evacuation dynamics in a tunnel space. A series of simulation experiments were conducted to evaluate the simulating performance of the proposed ABM.
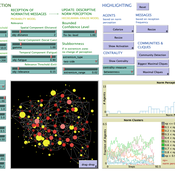
COMM-PDND: Communication-Based Model of Perceived Descriptive Norm Dynamics in Digital Networks
Lars Reinelt | Published Friday, September 08, 2023The Communication-Based Model of Perceived Descriptive Norm Dynamics in Digital Networks (COMM-PDND) is an agent-based model specifically created to examine the dynamics of perceived descriptive norms in the context of digital network structures. The model, developed as part of a master’s thesis titled “The Dynamics of Perceived Descriptive Norms in Digital Network Publics: An Agent-Based Simulation,” emphasizes the critical role of communication processes in norm formation. It focuses on the role of communicative interactions in shaping perceived descriptive norms.
The COMM-PDND is tuned to explore the effects of normative deviance in digital social networks. It provides functionalities for manipulating agents according to their network position, and has a versatile set of customizable parameters, making it adaptable to a wide range of research contexts.
Pedestrian model
Dana Kaziyeva Petra Stutz Gudrun Wallentin Martin Loidl | Published Monday, August 07, 2023The model generates disaggregated traffic flows of pedestrians, simulating their daily mobility behaviour represented as probabilistic rules. Various parameters of physical infrastructure and travel behaviour can be altered and tested. This allows predicting potential shifts in traffic dynamics in a simulated setting. Moreover, assumptions in decision-making processes are general for mid-sized cities and can be applied to similar areas.
Together with the model files, there is the ODD protocol with the detailed description of model’s structure. Check the associated publication for results and evaluation of the model.
Installation
Download GAMA-platform (GAMA1.8.2 with JDK version) from https://gama-platform.github.io/. The platform requires a minimum of 4 GB of RAM.
…
Displaying 10 of 395 results simulation clear