About the CoMSES Model Library more info
Our mission is to help computational modelers at all levels engage in the establishment and adoption of community standards and good practices for developing and sharing computational models. Model authors can freely publish their model source code in the Computational Model Library alongside narrative documentation, open science metadata, and other emerging open science norms that facilitate software citation, reproducibility, interoperability, and reuse. Model authors can also request peer review of their computational models to receive a DOI.
All users of models published in the library must cite model authors when they use and benefit from their code.
Please check out our model publishing tutorial and contact us if you have any questions or concerns about publishing your model(s) in the Computational Model Library.
We also maintain a curated database of over 7500 publications of agent-based and individual based models with additional detailed metadata on availability of code and bibliometric information on the landscape of ABM/IBM publications that we welcome you to explore.
Displaying 10 of 180 results Data clear
Social identity approach in a data-driven Axelrod model
alejandrodinkelberg | Published Thursday, July 28, 2022Simulations based on the Axelrod model and extensions to inspect the volatility of the features over time (AXELROD MODEL & Agreement threshold & two model variations based on the Social identity approach)
The Axelrod model is used to predict the number of changes per feature in comparison to the datasets and is used to compare different model variations and their performance.
Input: Real data
…
DroneStrikes_TerroristAttacks
B Shapiro | Published Friday, July 15, 2022ABM focused on examining the dissemination of opinions through a notional terrorist network to generate terrorist attacks caused by drone strikes.
3D Urban Traffic Simulator (ABM) in Unity
Sedar Olmez Obi Thompson Sargoni Alison Heppenstall Daniel Birks Annabel Whipp Ed Manley | Published Friday, January 22, 2021 | Last modified Monday, March 22, 2021The Urban Traffic Simulator is an agent-based model developed in the Unity platform. The model allows the user to simulate several autonomous vehicles (AVs) and tune granular parameters such as vehicle downforce, adherence to speed limits, top speed in mph and mass. The model allows researchers to tune these parameters, run the simulator for a given period and export data from the model for analysis (an example is provided in Jupyter Notebook).
The data the model is currently able to output are the following:
…
Peer reviewed Social Consequences of Past Compound Events - Laacher See Eruption
Kevin Su Brennen Bouwmeester | Published Monday, May 17, 2021Resilience of humans in the Upper Paleolithic could provide insights in how to defend against today’s environmental threats. Approximately 13,000 years ago, the Laacher See volcano located in present-day western Germany erupted cataclysmically. Archaeological evidence suggests that this is eruption – potentially against the background of a prolonged cold spell – led to considerable culture change, especially at some distance from the eruption (Riede, 2017). Spatially differentiated and ecologically mediated effects on contemporary social networks as well as social transmission effects mediated by demographic changes in the eruption’s wake have been proposed as factors that together may have led to, in particular, the loss of complex technologies such as the bow-and-arrow (Riede, 2014; Riede, 2009).
This model looks at the impact of the interaction between climate change trajectory and an extreme event, such as the Laacher See eruption, on the generational development of hunter-gatherer bands. Historic data is used to model the distribution and population dynamics of hunter-gatherer bands during these circumstances.
Holmestrand School Model
Jessica Dimka | Published Friday, June 18, 2021 | Last modified Friday, April 29, 2022The Holmestrand model is an epidemiological agent-based model. Its aim is to test hypotheses related to how the social and physical environment of a residential school for children with disabilities might influence the spread of an infectious disease epidemic among students and staff. Annual reports for the Holmestrand School for the Deaf (Norway) are the primary sources of inspiration for the modeled school, with additional insights drawn from other archival records for schools for children with disabilities in early 20th century Norway and data sources for the 1918 influenza pandemic. The model environment consists of a simplified boarding school that includes residential spaces for students and staff, classrooms, a dining room, common room, and an outdoor area. Students and staff engage in activities reflecting hourly schedules suggested by school reports. By default, a random staff member is selected as the first case and is infected with disease. Subsequent transmission is determined by agent movement and interactions between susceptible and infectious pairs.
Correlated random walk
Thibault Fronville | Published Friday, April 01, 2022 | Last modified Monday, April 25, 2022The first simple movement models used unbiased and uncorrelated random walks (RW). In such models of movement, the direction of the movement is totally independent of the previous movement direction. In other words, at each time step the direction, in which an individual is moving is completely random. This process is referred to as a Brownian motion.
On the other hand, in correlated random walks (CRW) the choice of the movement directions depends on the direction of the previous movement. At each time step, the movement direction has a tendency to point in the same direction as the previous one. This movement model fits well observational movement data for many animal species.
The presented agent based model simulated the movement of the agents as a correlated random walk (CRW). The turning angle at each time step follows the Von Mises distribution with a ϰ of 10. The closer ϰ gets to zero, the closer the Von Mises distribution becomes uniform. The larger ϰ gets, the more the Von Mises distribution approaches a normal distribution concentrated around the mean (0°).
This model is implemented in python and can be used as a building block for more complex agent based models that would rely on describing the movement of individuals with CRW.
RaMDry - Rangeland Model in Drylands
Pascal Fust Eva Schlecht | Published Friday, January 05, 2018 | Last modified Friday, April 01, 2022RaMDry allows to study the dynamic use of forage ressources by herbivores in semi-arid savanna with an emphasis on effects of change of climate and management. Seasonal dynamics affects the amount and the nutritional values of the available forage.
Vacunación-Covid Ecuador
Adrian Lara | Published Tuesday, March 22, 2022El modelo a continuación, fue desarrollado para el DATA CHALLENGE 2022. Es un análisis de la información descargada del Portal de datos abiertos de Ecuador. Dentro del modelo podemos realizar una breve exploración de la información así como una simulación respecto al proceso de vacunación en Ecuador.
User Guide and Templates for RAT-RS (a reporting standard for improving the documentation of data use in agent-based modelling)
Peer-Olaf Siebers Sebastian Achter Melania Borit Edmund Chattoe-Brown | Published Saturday, March 12, 2022The Rigor and Transparency Reporting Standard (RAT-RS) is a tool to improve the documentation of data use in Agent-Based Modelling. Following the development of reporting standards for models themselves, attention to empirical models has now reached a stage where these standards need to take equally effective account of data use (which until now has tended to be an afterthought to model description). It is particularly important that a standard should allow the reporting of the different uses to which data may be put (specification, calibration and validation), but also that it should be compatible with the integration of different kinds of data (for example statistical, qualitative, ethnographic and experimental) sometimes known as mixed methods research.
For the full details on the RAT-RS, please refer to the related publication “RAT-RS: A Reporting Standard for Improving the Documentation of Data Use in Agent-Based Modelling” (http://dx.doi.org/10.1080/13645579.2022.2049511).
Here we provide supplementary material for this article, consisting of a RAT-RS user guide and RAT-RS templates.
Peer reviewed Agent-based model to simulate equilibria and regime shifts emerged in lake ecosystems
no contributors listed | Published Tuesday, January 25, 2022(An empty output folder named “NETLOGOexperiment” in the same location with the LAKEOBS_MIX.nlogo file is required before the model can be run properly)
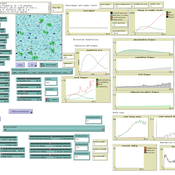
The model is motivated by regime shifts (i.e. abrupt and persistent transition) revealed in the previous paleoecological study of Taibai Lake. The aim of this model is to improve a general understanding of the mechanism of emergent nonlinear shifts in complex systems. Prelimnary calibration and validation is done against survey data in MLYB lakes. Dynamic population changes of function groups can be simulated and observed on the Netlogo interface.
Main functional groups in lake ecosystems were modelled as super-individuals in a space where they interact with each other. They are phytoplankton, zooplankton, submerged macrophyte, planktivorous fish, herbivorous fish and piscivorous fish. The relationships between these functional groups include predation (e.g. zooplankton-phytoplankton), competition (phytoplankton-macrophyte) and protection (macrophyte-zooplankton). Each individual has properties in size, mass, energy, and age as physiological variables and reproduce or die according to predefined criteria. A system dynamic model was integrated to simulate external drivers.
Set biological and environmental parameters using the green sliders first. If the data of simulation are to be logged, set “Logdata” as true and input the name of the file you want the spreadsheet(.csv) to be called. You will need create an empty folder called “NETLOGOexperiment” in the same level and location with the LAKEOBS_MIX.nlogo file. Press “setup” to initialise the system and “go” to start life cycles.
Displaying 10 of 180 results Data clear
