About the CoMSES Model Library more info
Our mission is to help computational modelers at all levels engage in the establishment and adoption of community standards and good practices for developing and sharing computational models. Model authors can freely publish their model source code in the Computational Model Library alongside narrative documentation, open science metadata, and other emerging open science norms that facilitate software citation, reproducibility, interoperability, and reuse. Model authors can also request peer review of their computational models to receive a DOI.
All users of models published in the library must cite model authors when they use and benefit from their code.
Please check out our model publishing tutorial and contact us if you have any questions or concerns about publishing your model(s) in the Computational Model Library.
We also maintain a curated database of over 7500 publications of agent-based and individual based models with additional detailed metadata on availability of code and bibliometric information on the landscape of ABM/IBM publications that we welcome you to explore.
Displaying 10 of 79 results for 'No%C3%A9%20Guiraud'
The Urban Drought Nexus Tool
Roger Cremades Muhamad Khairulbahri | Published Thursday, December 14, 2023The “Urban Drought Nexus Tool” is a system dynamics model, aiming to facilitate the co-development of climate services for cities under increasing droughts. The tool integrates multiple types of information and still can be applied to other case studies with minimal adjustments on the parameters of land use, water consumption and energy use in the water sector. The tool needs hydrological projections under climate scenarios to evaluate climatic futures, and requires the co-creation of socio-economic future scenarios with local stakeholders. Thus it is possible to provide specific information about droughts taking into account future water availability and future water consumption. Ultimately, such complex system as formed by the water-energy-land nexus can be reduced to single variables of interest, e.g. the number of events with no water available in the future and their length, so that the complexities are reduced and the results can be conveyed to society in an understandable way, including the communication of uncertainties. The tool and an explanatory guide in pdf format are included. Planned further developments include calibrating the system dynamics model with the social dynamics behind each flow with agent-based models.
DARTS: an agent-based model of the global food system for studying its resilience to shocks
Hubert Fonteijn | Published Wednesday, November 22, 2023DARTS simulates food systems in which agents produce, consume and trade food. Here, food is a summary item that roughly corresponds to commodity food types (e.g. rice). No other food types are taken into account. Each food system (World) consists of its own distribution of agents, regions and connections between agents. Agents differ in their ability to produce food, earn off-farm income and trade food. The agents aim to satisfy their food requirements (which are fixed and equal across agents) by either their own food production or by food purchases. Each simulation step represents one month, in which agents can produce (if they have productive capacity and it is a harvest month for their region), earn off-farm income, trade food (both buy and sell) and consume food. We evaluate the performance of the food system by averaging the agents’ food satisfaction, which is defined as the ratio of the food consumed by each agent at the end of each month divided by her food requirement. At each step, any of the abovementioned attributes related to the agents’ ability to satisfy their food requirement can (temporarily) be shocked. These shocks include reducing the amount of food they produce, removing their ability to trade locally or internationally and reducing their cash savings. Food satisfaction is quantified (both immediately after the shock and in the year following the shock) to evaluate food security of a particular food system, both at the level of agent types (e.g. the urban poor and the rural poor) and at the systems level. Thus, the effects of shocks on food security can be related to the food system’s structure.
Peer reviewed Yards
Emily Minor Soraida Garcia srailsback Philip Johnson | Published Thursday, November 02, 2023This is a model of plant communities in urban and suburban residential neighborhoods. These plant communities are of interest because they provide many benefits to human residents and also provide habitat for wildlife such as birds and pollinators. The model was designed to explore the social factors that create spatial patterns in biodiversity in yards and gardens. In particular, the model was originally developed to determine whether mimicry behaviors–-or neighbors copying each other’s yard design–-could produce observed spatial patterns in vegetation. Plant nurseries and socio-economic constraints were also added to the model as other potential sources of spatial patterns in plant communities.
The idea for the model was inspired by empirical patterns of spatial autocorrelation that have been observed in yard vegetation in Chicago, Illinois (USA), and other cities, where yards that are closer together are more similar than yards that are farther apart. The idea is further supported by literature that shows that people want their yards to fit into their neighborhood. Currently, the yard attribute of interest is the number of plant species, or species richness. Residents compare the richness of their yards to the richness of their neighbors’ yards. If a resident’s yard is too different from their neighbors, the resident will be unhappy and change their yard to make it more similar.
The model outputs information about the diversity and identity of plant species in each yard. This can be analyzed to look for spatial autocorrelation patterns in yard diversity and to explore relationships between mimicry behaviors, yard diversity, and larger scale diversity.
Learning Extension - RAGE RAngeland Grazing Model
Cristina I. Apetrei Nikita Strelkovskii Nikolay Khabarov Valeria Javalera Rincón | Published Saturday, July 22, 2023This is an extension of the original RAGE model (Dressler et al. 2018), where we add learning capabilities to agents, specifically learning-by-doing and social learning (two processes central to adaptive (co-)management).
The extension module is applied to smallholder farmers’ decision-making - here, a pasture (patch) is the private property of the household (agent) placed on it and there is no movement of the households. Households observe the state of the pasture and their neighrbours to make decisions on how many livestock to place on their pasture every year. Three new behavioural types are created (which cannot be combined with the original ones): E-RO (baseline behaviour), E-LBD (learning-by-doing) and E-RO-SL1 (social learning). Similarly to the original model, these three types can be compared regarding long-term social-ecological performance. In addition, a global strategy switching option (corresponding to double-loop learning) allows users to study how behavioural strategies diffuse in a heterogeneous population of learning and non-learning agents.
An important modification of the original model is that extension agents are heterogeneous in how they deal with uncertainty. This is represented by an agent property, called the r-parameter (household-risk-att in the code). The r-parameter is catch-all for various factors that form an agent’s disposition to act in a certain way, such as: uncertainty in the sensing (partial observability of the resource system), noise in the information received, or an inherent characteristic of the agent, for instance, their risk attitude.
Peer reviewed SIM-VOLATILE: Adoption of emerging circular technologies in the waste-treatment sector
Siavash Farahbakhsh | Published Wednesday, December 14, 2022The SIM-VOLATILE model is a technology adoption model at the population level. The technology, in this model, is called Volatile Fatty Acid Platform (VFAP) and it is in the frame of the circular economy. The technology is considered an emerging technology and it is in the optimization phase. Through the adoption of VFAP, waste-treatment plants will be able to convert organic waste into high-end products rather than focusing on the production of biogas. Moreover, there are three adoption/investment scenarios as the technology enables the production of polyhydroxyalkanoates (PHA), single-cell oils (SCO), and polyunsaturated fatty acids (PUFA). However, due to differences in the processing related to the products, waste-treatment plants need to choose one adoption scenario.
In this simulation, there are several parameters and variables. Agents are heterogeneous waste-treatment plants that face the problem of circular economy technology adoption. Since the technology is emerging, the adoption decision is associated with high risks. In this regard, first, agents evaluate the economic feasibility of the emerging technology for each product (investment scenarios). Second, they will check on the trend of adoption in their social environment (i.e. local pressure for each scenario). Third, they combine these two economic and social assessments with an environmental assessment which is their environmental decision-value (i.e. their status on green technology). This combination gives the agent an overall adaptability fitness value (detailed for each scenario). If this value is above a certain threshold, agents may decide to adopt the emerging technology, which is ultimately depending on their predominant adoption probabilities and market gaps.
Peer reviewed Price Evolution with Expectations
J Applegate Gesine Steudel Armin Haas Carlo Jaeger | Published Friday, September 10, 2021The Price Evolution with Expectations model provides the opportunity to explore the question of non-equilibrium market dynamics, and how and under which conditions an economic system converges to the classically defined economic equilibrium. To accomplish this, we bring together two points of view of the economy; the classical perspective of general equilibrium theory and an evolutionary perspective, in which the current development of the economic system determines the possibilities for further evolution.
The Price Evolution with Expectations model consists of a representative firm producing no profit but producing a single good, which we call sugar, and a representative household which provides labour to the firm and purchases sugar.The model explores the evolutionary dynamics whereby the firm does not initially know the household demand but eventually this demand and thus the correct price for sugar given the household’s optimal labour.
The model can be run in one of two ways; the first does not include money and the second uses money such that the firm and/or the household have an endowment that can be spent or saved. In either case, the household has preferences for leisure and consumption and a demand function relating sugar and price, and the firm has a production function and learns the household demand over a set number of time steps using either an endogenous or exogenous learning algorithm. The resulting equilibria, or fixed points of the system, may or may not match the classical economic equilibrium.
Peer reviewed Personnel decisions in the hierarchy
Smarzhevskiy Ivan | Published Friday, August 19, 2022This is a model of organizational behavior in the hierarchy in which personnel decisions are made.
The idea of the model is that the hierarchy, busy with operations, is described by such characteristics as structure (number and interrelation of positions) and material, filling these positions (persons with their individual performance). A particular hierarchy is under certain external pressure (performance level requirement) and is characterized by the internal state of the material (the distribution of the perceptions of others over the ensemble of persons).
The World of the model is a four-level hierarchical structure, consisting of shuff positions of the top manager (zero level of the hierarchy), first-level managers who are subordinate to the top manager, second-level managers (subordinate to the first-level managers) and positions of employees (the third level of the hierarchy). ) subordinated to the second-level managers. Such a hierarchy is a tree, i.e. each position, with the exception of the position of top manager, has a single boss.
Agents in the model are persons occupying the specified positions, the number of persons is set by the slider (HumansQty). Personas have some operational performance (harisma, an unfortunate attribute name left over from the first edition of the model)) and a sense of other personas’ own perceptions. Performance values are distributed over the ensemble of persons according to the normal law with some mean value and variance.
The value of perception by agents of each other is positive or negative (implemented in the model as numerical values equal to +1 and -1). The distribution of perceptions over an ensemble of persons is implemented as a random variable specified by the probability of negative perception, the value of which is set by the control elements of the model interface. The numerical value of the probability equal to 0 corresponds to the case in which all persons positively perceive each other (the numerical value of the random variable is equal to 1, which corresponds to the positive perception of the other person by the individual).
The hierarchy is occupied with operational activity, the degree of intensity of which is set by the external parameter Difficulty. The level of productivity of each manager OAIndex is equal to the level of productivity of the department he leads and is the ratio of the sum of productivity of employees subordinate to the head to the level of complexity of the work Difficulty. An increase in the numerical value of Difficulty leads to a decrease in the OAIndex for all subdivisions of the hierarchy. The managerial meaning of the OAIndex indicator is the percentage of completion of the load specified for the hierarchy as a whole, i.e. the ratio of the actual performance of the structural subdivisions of the hierarchy to the required performance, the level of which is specified by the value of the Difficulty parameter.
…
Agent-based simulation of discussion processes in risk workshops with quantitative skepticism
Lucia Bellora-Bienengräber Clemens Harten Matthias Meyer | Published Sunday, August 14, 2022The model measures drivers of effectiveness of risk assessments in risk workshops where a calculative culture of quantitative skepticism is present. We model the limits to information transfer, incomplete discussions, group characteristics, and interaction patterns and investigate their effect on risk assessment in risk workshops, in order to contrast results to a previous model focused on a calculative culture of quantitative enthusiasm.
The model simulates a discussion in the context of a risk workshop with 9 participants. The participants use constraint satisfaction networks to assess a given risk individually and as a group.
An agent-based simulation of discussion processes in risk workshops
Clemens Harten Matthias Meyer Lucia Bellora-Bienengräber | Published Thursday, September 30, 2021The model measures drivers of effectiveness of risk assessments in risk workshops regarding the correctness and required time. Specifically, we model the limits to information transfer, incomplete discussions, group characteristics, and interaction patterns and investigate their effect on risk assessment in risk workshops.
The model simulates a discussion in the context of a risk workshop with 9 participants. The participants use Bayesian networks to assess a given risk individually and as a group.
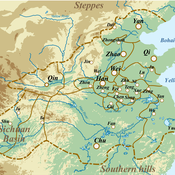
Evolutionary Dynamics of the Warring States Period: Initial Unification in Ancient China (475 BC to 221 BC)
zhuo zhang | Published Sunday, August 07, 2022If you have any questions about the model run, please send me an email and I will respond as soon as possible.
Under complex system perspectives, we build the multi-agent system to back-calculate this unification process of the Warring State period, from 32 states in 475 BC to 1 state (Qin) in 221 BC.
Displaying 10 of 79 results for 'No%C3%A9%20Guiraud'