Our mission is to help computational modelers develop, document, and share their computational models in accordance with community standards and good open science and software engineering practices. Model authors can publish their model source code in the Computational Model Library with narrative documentation as well as metadata that supports open science and emerging norms that facilitate software citation, computational reproducibility / frictionless reuse, and interoperability. Model authors can also request private peer review of their computational models. Models that pass peer review receive a DOI once published.
All users of models published in the library must cite model authors when they use and benefit from their code.
Please check out our model publishing tutorial and feel free to contact us if you have any questions or concerns about publishing your model(s) in the Computational Model Library.
Displaying 10 of 132 results for "Alistair Law" clear search
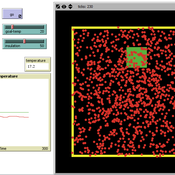
Thermostat II
María Pereda Jesús M Zamarreño | Published Thursday, June 12, 2014 | Last modified Monday, June 16, 2014A thermostat is a device that allows to have the temperature in a room near a desire value.
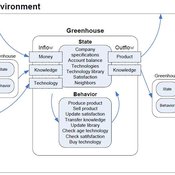
Universal Darwinism in Dutch Greenhouses
Julia Kasmire | Published Wednesday, May 09, 2012 | Last modified Saturday, April 27, 2013An ABM, derived from a case study and a series of surveys with greenhouse growers in the Westland, Netherlands. Experiments using this model showshow that the greenhouse horticulture industry displays diversity, adaptive complexity and an uneven distribution, which all suggest that the industry is an evolving system.
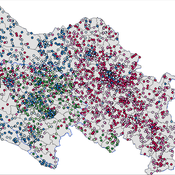
This is the final version of the model. To simulate the normative dynamics we used the EmIL (EMergence In the Loop) Framework which was kindly provided by Ulf Lotzmann. http://cfpm.org/EMIL-D5.1.pdf
Agent-Based Simulation of Operational and Fare Integration in Multi-Operator Bus Networks: Institutional Trade-offs and Robustness Analysis
Lorenzo Ros-McDonnell María Victoria de-la-Fuente-Aragon Salvador Martinez-Artero-Martinez Khaoula El Bied | Published Tuesday, November 03, 2026This study separates operational interoperability, fare integration and revenue-sharing governance in a stylised multi-operator bus network. An agent-based model implemented in NetLogo 7.0.3 represents passengers, buses and stations across 14 stations, nine routes and three operators. A 2 × 2 institutional design is complemented by financial clearing comparisons and 43,200 robustness runs: behavioural sensitivity (E1), a 243-configuration operational factorial (E2), and targeted joint behavioural–operational stress testing (E3). The audited experiment records show favourable interoperability effects on waiting, total travel time, transfers and realised generalised cost in all 1,944 E2 and 768 E3 configuration-level primary comparisons. Fare integration substantially reduces passenger expenditure but produces an aggregate deficit under the assumed accounting coefficients. Revenue-sharing rules redistribute operator-level outcomes without changing aggregate profit or passenger trajectories by construction. The model is intended to identify mechanisms and test conditional robustness, not predict city-specific policy effects. The paper contributes an explicit separation of access, pricing and settlement mechanisms coupled with reproducible factorial and stress-test comparisons.
Peer reviewed Green Consumption Tipping Point
Mario | Published Thursday, February 26, 2026This model is a minimal agent-based model (ABM) of green consumption and market tipping dynamics in a stylised two-firm economy. It is designed as an existence proof to illustrate how weak individual preferences, when combined with habit formation, social influence, and firm price adaptation, can generate non-linear transitions (tipping points) in market outcomes.
The economy consists of:
1) Two firms, each supplying a differentiated consumption bundle that differs in its fixed green share (one relatively greener, one less green).
2) Many households, each consuming a unit mass per period and allocating consumption between the two firms.
…
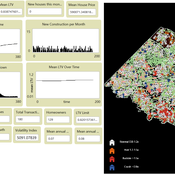
ZIP-Level Housing Supply Elasticity and Crash Dynamics: A GIS-Based Agent-Based Model of the Washington DC and Northern Virginia Metro Region
Mansoor Abdul Bari | Published Saturday, August 01, 2026 | Last modified Sunday, August 02, 2026This model tests whether local housing supply elasticity governs crash severity inside a single metropolitan housing market. Saiz (2010) established that across US metros, regions constrained by geography and regulation experience deeper boom-bust cycles than flexible ones. That finding is routinely applied downward to neighborhoods and ZIP codes as though the mechanism scaled without qualification.
The empirical record for the Washington DC and Northern Virginia region says it does not. Across 84 ZIP codes, measured supply elasticity ranges from 0.35 to 4.95 with a median of 1.21. The worst single-year price decline between 2007 and 2012 averaged 9.6 percent in constrained ZIP codes and 9.0 percent in flexible ones, a gap that cannot be distinguished from noise. Wide variation in the proposed cause, no meaningful separation in the proposed effect.
The model embeds households, houses and a metro-wide credit condition in the real ZIP geography of the region using three GIS layers and an empirical price panel. Local elasticity governs construction, exactly as theory predicts. Prices are driven by a shared macro drift schedule and, under the credit-amplified mode, by a leverage cycle with a financial accelerator and a deviation penalty. The design question is whether those shared forces are sufficient to override local supply differences at the sub-metropolitan scale.
…
Exploring the Effects of Link Recommendations on Social Networks
Ciara Sibley Andrew Crooks | Published Thursday, March 19, 2020The purpose of this model is explore how “friend-of-friend” link recommendations, which are commonly used on social networking sites, impact online social network structure. Specifically, this model generates online social networks, by connecting individuals based upon varying proportions of a) connections from the real world and b) link recommendations. Links formed by recommendation mimic mutual connection, or friend-of-friend algorithms. Generated networks can then be analyzed, by the included scripts, to assess the influence that different proportions of link recommendations have on network properties, specifically: clustering, modularity, path length, eccentricity, diameter, and degree distribution.
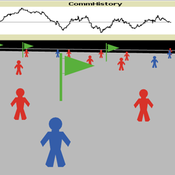
Model of communication between two groups of managers in the course of project implementation
Smarzhevskiy Ivan | Published Monday, December 07, 2020This is a simulation model of communication between two groups of managers in the course of project implementation. The “world” of the model is a space of interaction between project participants, each of which belongs either to a group of work performers or to a group of customers. Information about the progress of the project is publicly available and represents the deviation Earned value (EV) from the planned project value (cost baseline).
The key elements of the model are 1) persons belonging to a group of customers or performers, 2) agents that are communication acts. The life cycle of persons is equal to the time of the simulation experiment, the life cycle of the communication act is 3 periods of model time (for the convenience of visualizing behavior during the experiment). The communication act occurs at a specific point in the model space, the coordinates of which are realized as random variables. During the experiment, persons randomly move in the model space. The communication act involves persons belonging to a group of customers and a group of performers, remote from the place of the communication act at a distance not exceeding the value of the communication radius (MaxCommRadius), while at least one representative from each of the groups must participate in the communication act. If none are found, the communication act is not carried out. The number of potential communication acts per unit of model time is a parameter of the model (CommPerTick).
The managerial sense of the feedback is the stimulating effect of the positive value of the accumulated communication complexity (positive background of the project implementation) on the productivity of the performers. Provided there is favorable communication (“trust”, “mutual understanding”) between the customer and the contractor, it is more likely that project operations will be performed with less lag behind the plan or ahead of it.
The behavior of agents in the world of the model (change of coordinates, visualization of agents’ belonging to a specific communicative act at a given time, etc.) is not informative. Content data are obtained in the form of time series of accumulated communicative complexity, the deviation of the earned value from the planned value, average indicators characterizing communication - the total number of communicative acts and the average number of their participants, etc. These data are displayed on graphs during the simulation experiment.
The control elements of the model allow seven independent values to be varied, which, even with a minimum number of varied values (three: minimum, maximum, optimum), gives 3^7 = 2187 different variants of initial conditions. In this case, the statistical processing of the results requires repeated calculation of the model indicators for each grid node. Thus, the set of varied parameters and the range of their variation is determined by the logic of a particular study and represents a significant narrowing of the full set of initial conditions for which the model allows simulation experiments.
…
Peer reviewed MOOvPOPsurveillance
Aniruddha Belsare Matthew Gompper Joshua J Millspaugh | Published Tuesday, April 04, 2017 | Last modified Tuesday, May 12, 2020MOOvPOPsurveillance was developed as a tool for wildlife agencies to guide collection and analysis of disease surveillance data that relies on non-probabilistic methods like harvest-based sampling.
Hollywood Underrepresentation Simulated Causes
Carmen Iasiello | Published Sunday, November 26, 2023Presented here is a socioeconomic agent-based model (ABM) to examine the Hollywood labor system as a network within a simulated movie labor market based on preferential attachment and compare the findings with 50 co-production ego networks during the 2015 movie year. Using the ABM, I test the role slight individual preference for racial and ethnic similarity within one’s own network at the microlevel and find that it is insufficient to explain the phenomena of racial and ethnic underrepresentation at the macrolevel. The ABM also includes the ability to test alternative explanations, such as overt opportunity loss as a possible explanation.
Displaying 10 of 132 results for "Alistair Law" clear search